Peak Oil is You

Donate Bitcoins ;-) or Paypal :-)
Page added on February 11, 2012
Why Is Gasoline Consumption Tanking?

Gasoline deliveries reflect recession and growth. The recent drop in retail gasoline deliveries is signalling a sharp contraction ahead.
Mish recently posted some intriguing charts depicting a significant decline in gasoline consumption (additional charts here). Then correspondent Joe R. forwarded me this stunning chart of gasoline retail deliveries, from the U.S. Energy Information Administration: (EIA)
As Joe noted, this data is interesting because it is un-manipulated, that is, it is not “seasonally adjusted” or run through some black-box modifications like so much other government data.
Retail gasoline deliveries, already well below 1980 levels, have absolutely fallen off a cliff. Is the plunge inventory-related, i.e. are storage facilities so full that retailers are simply putting off deliveries?
Though I don’t have data on hand to support this, I know from one of my correspondents who is in the gasoline distribution/delivery business that gasoline is very much a “just in time” commodity: gas stations are often close to running out of fuel when they get a delivery. Stations aren’t holding huge quantities of surplus gasoline; that’s not how the business works.
Given the absence of “extra storage” in gas stations (and the fact that the number of gas stations has fallen dramatically since 1980), it is reasonable to conclude that retail delivery is largely a function of demand, i.e. gasoline consumption.
Even if you dismiss the recent plunge as an outlier, the declines in retail gasoline deliveries are mind-boggling. If you look at the data from 1983 to 2011 on the link above, you will note that delivery declines align with recessions.
For example, deliveries jumped from 50.1 million gallons per day (MGD) in November 1983, when the nation was emerging from the deepest postwar recession then on record, to 58 MGD the following November (1984).
Deliveries steadily rose to a peak of 67.1 MGD in July 1998, declined marginally in the 2001-2 recession and then surged to 66.8 MGD in August 2003. If we just look at one month–say November–then we see that deliveries remained in a remarkably consistent channel from 1994 to 2008, between 54 MGD and 63 MGD, with the higher numbers occuring in the “peak bubble years” of 1998 and 2003.
In 2010, gasoline deliveries declined to the low 40s–literally falling off the charts. In November 1983, deliveries were 51.1 MGD; in November 2010, they were 42.8 MGD, and in November 2011 they were 30.9 MGD.
Does this reflect higher fuel efficiencies in the U.S. vehicle fleet? To examine fuel efficiency and other macro-trends, I assembled some charts of fuel efficiency (courtesy of the Early Warning blog) and a graph of employment, a commonly used proxy for economic activity/growth.
Let’s start with some basic data about population and vehicles. There are 254 million passenger vehicles registered in the U.S. Some percentage of these are classic cars and other vehicles that aren’t driven much, but nonetheless the number of vehicles that are in regular use is large.
U.S. population in 1983 was approximately 234 million. The U.S. Census Bureau estimates the current population at 313 million.
Vehicle sales declined from a record 17.4 million in 2000 to 11.5 million in 2010.
People are driving less: The Road… Less Traveled: An Analysis of Vehicle Miles Traveled Trends in the U.S.. (2008)
Driving, as measured by national Vehicle Miles Traveled (VMT), began to plateau as far back as 2004 and dropped in 2007 for the first time since 1980. Per capita driving followed a similar pattern, with flat-lining growth after 2000 and falling rates since 2005. These recent declines in driving predated the steady hikes in gas prices during 2007 and 2008. Moreover, the recent drops in VMT (90 billion miles) and VMT per capita (388 miles) are the largest annualized drops since World War II.
Here are two charts of U.S. employment which show two periods of strong expansion: in the late 1990s and in 2002-08.
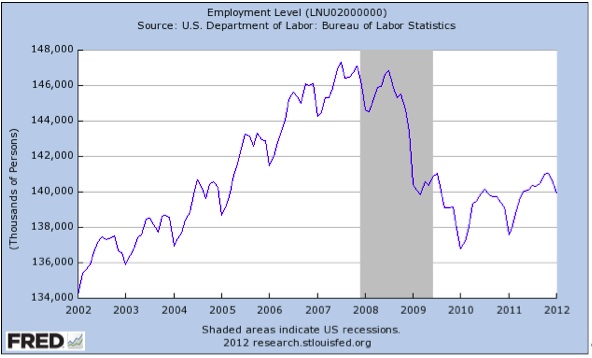
If the number of jobs were correlated to gasoline deliveries, then we would expect deliveries to be close to those registered in 2003 and 1999, since the number of jobs has declined to the levels of those years.
Instead, we find deliveries are dramatically lower:
November 1999: 59 MGD
November 2003: 63.8 MGD
November 2010: 42.8 MGD
Once again, this is not an outlier: deliveries for all of 2010 were between 42 and 46 MGD, compared to deliveries in the high 50s/mid 60s in 1999 and 2003.
There are all kinds of other things that influence the number of miles driven, but there is little evidence that any one factor can account for a 47% drop in retail gasoline deliveries. For example, it is well-known that the U.S. economy has shifted to a digital, service economy in the past 30 years, and since more people can “consume” (via shopping at amazon.com, etc.) and “produce” (work from home) without driving, then it makes sense that people are driving less.
But if we examine the data, it’s difficult to attribute the massive recent drops to people ordering stuff online or working from home more. After all, people were working from home and ordering stuff online in 2003, when gas deliveries reached 63 MGD, and in November 2006, when deliveries were 58.8 MGD.
Deliveries in November 2011 were 30.9 MGD, a staggering 47% decline.
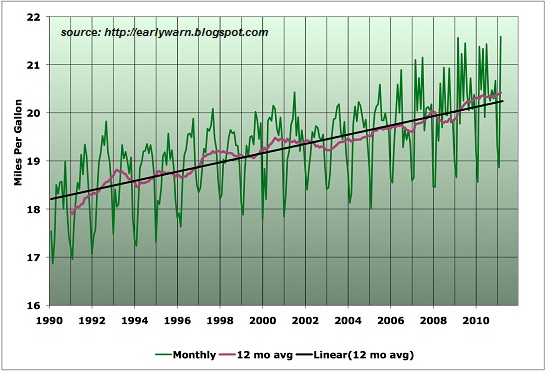
What about fuel efficiency? here are two charts from the Early Warning blog. They show a significant increase in the 1980s, but only modest improvement through the 1990s and 2000s.
If we use the same year as in the employment analysis, 1999, we see there was a 6% rise in efficiency from 1999 to 2010. This would suggest 6% of the decline in gasoline deliveries can be attributed to increased efficiency. But what about the other 40% of the decline? That cannot be attributed to higher efficiency.
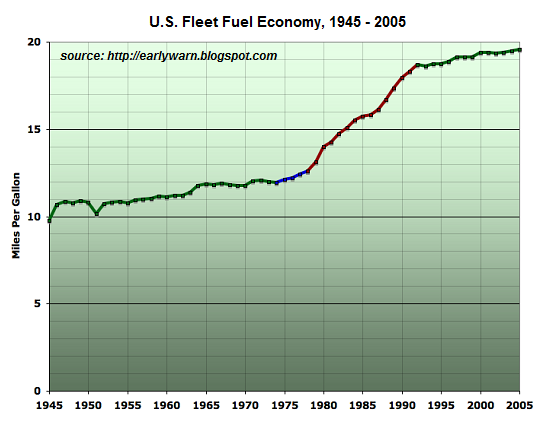
I’ve marked up the first chart to show the secular trends in efficiency and employment.
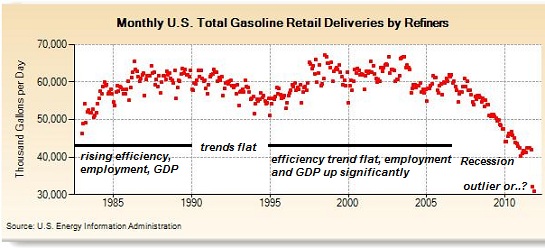
There are no data-supported broad-based drivers for dramatically lower gasoline consumption other than austerity and lower economic activity. The code-word for “austerity and lower economic activity” that is verboten in the Mainstream Media is “recession.” Indeed, if you examine the EIA data, the only causal factor that has backing in the data is recession–or if you prefer, austerity and lower economic activity.
Then there is the price of fuel. People have to go to work, pick up the kids, get their meds, etc., and few urban centers in the U.S. have mass transit systems that are up to the task of replacing autos. So most Americans have what we might call non-discretionary driving. But as the price of fuel rises, people find ways to lower their discretionary driving by combining trips, shopping less often, shortening or eliminating vacations, etc. Enterprises reduce costly business travel with teleconferences and other digital technologies.
Data supports the notion that high oil prices lead to recession. For example, Chris Martenson recently made a compelling case for this in Why Our Currency Will Fail (“Note that all of the six prior recessions were preceded by a spike in oil prices.”)
Household income doesn’t rise just because oil is climbing in cost, and so the extra money spent on fuel is diverted from other consumption or saving (capital accumulation). Higher fuel costs lower household capital formation and reduce consumption/economic activity.
Oil has been elevated for months, kissing $100 and rarely dipping below $90/barrel. Do higher oil costs explain the decline in gasoline consumption? Once again, they undoubtedly influence consumption, but that cannot explain the 40% drop in consumption. After all, when oil spiked in 2008 to $140/barrel, deliveries only dropped by a few million gallons: from 58.8 MGD in July 2007, before the spike, to 54.8 MGD at the point of maximum pain in July 2008.
The cost of oil has declined sharply from mid-2008, yet consumption has tanked from 54.8 MGD in July 2008 to 42.4 MGD in July 2011. That’s a hefty 21% decline.
What other plausible explanation is there for the decline from 42.4 MGD in July 2011 to 30.9 MGD in November 2011 other than a dramatic decline in discretionary driving? That 27% drop in a few months in unprecedented, except in times of war or sharp economic contraction, i.e. recession.
If we stipulate that vehicles and fuel consumption are essential proxies for the U.S. economy, then we can expect a steep decline in economic activity to register in other metrics within the next few months.
Such a sharp drop would of course be “unexpected” given the positive employment data of the past few months. But as the data above shows, employment isn’t tightly correlated to gasoline consumption: gasoline consumption reflects recession and growth.
In other words, look out below.
8 Comments on "Why Is Gasoline Consumption Tanking?"
BillT on Sat, 11th Feb 2012 3:30 pm
This is just common sense. When you are unemployed, (18+ million people) the car sits in the driveway. If your living expenses go up for necessities, you drive to Grandma’s fewer times and vacation in your back yard instead of driving to the shore.
Windmills on Sat, 11th Feb 2012 4:16 pm
Birds of a feather flock together and opposites attract are common sense, too. However, the best kind of “common sense” is the kind supported by good data. Otherwise, it’s just an old wives’ tale.
DC on Sat, 11th Feb 2012 5:53 pm
Yes, a lot of amerikans are out of work, and there going to stay that way. Thats a big factor. Here are a few others
In the US, you are litterally stranded if your poorly made GM or Ford w/e has been repossesed due to non-payment. Thus litle need for toxic fuel purchases
The roads in the US are saturated. There is no more room to build more over-saturated roads, and all things being equal, even amerikans that can afford to sit in traffic 6 hours a day are prob trying to find ways to avoid it..ie drive a lot less.
If you can afford to drive, or actually enjoy it, amerika has another nifty feature. There really isnt anyplace to go to anymore. Everyplace in amerika looks exactly like every other place. You start at your sytro-foam home, and end up going to the same banks, same big-box stores, same chain, same malls and theatres,chain resturants etc-everywhere. Call it comsumption, driver fatigue. If not for the road signs telling you your in a different town or city, 99x’s/100 youd be hard pressed to tell you went anywhere at all. Who in there right mind would want to climb into a over-priced heavilty decpricating drag on your wallet, and health, to be reminded of that all the time. When there is no where to drive to, and nothing you havent seen 1000xs allready, and the economy is in permanent decline, call it Peak-Driving. The point where u realize its pointless to go anywhere, except to work, or to get food.
Kenz300 on Sat, 11th Feb 2012 9:53 pm
There are many more 40 MPG vehicles being produced now as to the 18 MPG or less vehicles of 10 or 20 years ago. Also cash for clunkers purchased 690,114 cars were under the program. The average new car bought with the rebates got 9.2 mpg more than the average clunker traded in. 690,114 older cars were taken off the road, including 450,778 SUVs and other light trucks that got the worst gas mileage. As the price of gas continues to climb more people will be choosing energy efficient transportation.
MrEnergyCzar on Sat, 11th Feb 2012 10:33 pm
No need for a long explanation…. Less miles being driven, less people working…
MrEnergyCzar
Isaiah on Sun, 12th Feb 2012 12:46 am
Peak oil is a liberal hoax propagated by Big Oil and the media to justify higher oil prices and, thus maximize profits. It’s a scientific fact that oil is produced abiotically in the mantle of the earth; Russian scientists and Thomas Gold have proved this beyond a reasonable doubt. Furthermore, Baptist Preacher Lindsey Willians-who has close ties with unnamed top oil executives-has said that there is, at least, 200 years worth of oil in Alaska, but that it’s being capped off to raise prices. M. King Hubbert was a communist interloper who started the socialist idea of “finite resources” and “peak oil.” It’s our God-given right to drive Hemi-powered V8 trucks; don’t believe the Commie Pinko environmentalists and the liberal media with all their sky-is-falling and doom-and-gloom global warming & peak oil garbage. Also, don’t forget about the 100 years of shale gas and thousand years worth of coal that’ll power the American economy for centuries to come. This video disproves peak oil: http://www.youtube.com/watch?v=4bHZRSlhJxY
BillT on Sun, 12th Feb 2012 10:17 am
Isaiah, I watched that video…and couldn’t stop laughing. When he uses the Bible to prove his theory, he lost my interest. This man has zero intelligence and education. He may be a back woods preacher talking to people of like education and intelligence that believe his BS. Throwing around 1,000 years worth of this and that only makes him look like the fool he is. Sorry, but if you believe him, you are in for a real lot of pain in the next decades.
Rollin on Sun, 12th Feb 2012 8:56 pm
The premise of this article is based on the erroneous assumption that the “retail deliveries by refiners” graph represents the total amount of gasoline sold to consumers. Actually it only represents about 10 percent of the total. There are three other types of transactions listed that represent the total amount sold in the US. This graph is more representative of what it states, direct sales to service stations by the refiner. If we only used 30 million gallons a day, we would be using only 0.15 gallons/day/licensed driver or about 3.3 miles travel per day.