Peak Oil is You

Donate Bitcoins ;-) or Paypal :-)
Page added on April 19, 2016
Total U.S. Energy Production Increases for Sixth Consecutive Year

Source: U.S. Energy Information Administration, Monthly Energy Review
Total U.S. energy production increased for the sixth consecutive year. According to data in EIA’s most recent Monthly Energy Review, energy production reached a record 89 quadrillion British thermal units (Btu), equivalent to 91% of total U.S. energy consumption. Liquid fuels production drove the increase, with an 8% increase for crude oil and a 9% increase for natural gas plant liquids. Natural gas production also increased 5%. These gains more than offset a 10% decline in coal production.
The United States saw little change in production from nuclear electric power and renewable energy (across all sectors) in 2015. However, the United States saw shifts in the sources of electricity generation from renewable fuels, as declines in hydroelectric generation were mostly offset by increases in electricity genertation from wind and solar.
Other highlights for electricity generation in 2015 include:
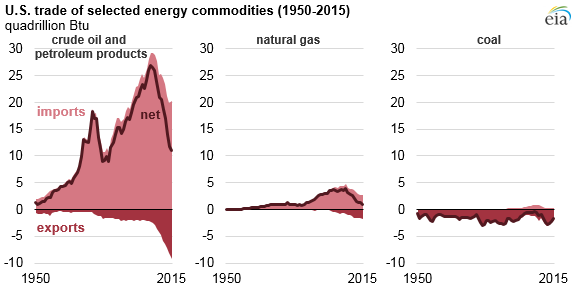
Net imports continued to decline. U.S. primary energy net imports declined for the 10th consecutive year. Imports rose 2%, but that increase was outpaced by a 6% increase in exports. Petroleum products accounted for 71% of U.S. primary energy exports.
Source: U.S. Energy Information Administration, Monthly Energy Review
The fuel mix of energy exports continues to change. In 2008, the U.S. exported more than twice as much coal as natural gas. In 2015, the U.S. exported only 0.1 quadrillion Btu more coal than natural gas. Mexico accounted for almost all of the increase in natural gas exports, while coal exports fell largely as a result of lower demand in Europe and China. Natural gas exports are expected to continue growing as the United States transitions from a net importer to a net exporter of natural gas by mid-2017.
Source: U.S. Energy Information Administration, Monthly Energy Review
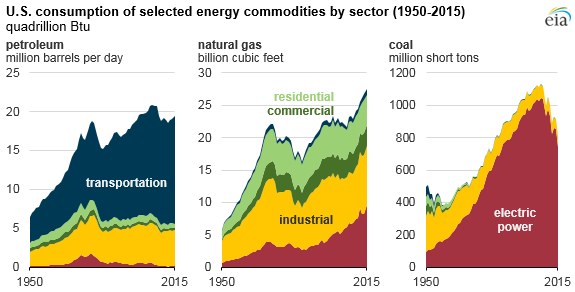
Coal led the decrease in consumption. Primary energy consumption declined 1% between 2014 and 2015. Coal consumption fell 13% over the same period. The decrease was mostly offset by a 3% increase in natural gas consumption and a 1% increase in petroleum consumption. Coal’s decline in the electric power sector was the major factor in the changing fuel mix of energy consumption. The industrial sector has also seen a shift from coal to natural gas consumption in recent years.
Primary energy consumption in the residential and commercial sectors decreased by 9% and 6%, respectively, in 2015. This decrease was likely attributable to a milder winter in 2015, as heating degree days (a measure used to calculate temperature-related energy demand) fell by 10% year-on-year. Meanwhile, transportation sector consumption increased by 2%. The electric power and industrial sectors each saw modest declines in consumption compared with 2014.
Carbon dioxide emissions fell. After increasing in 2013 and 2014, U.S. carbon dioxide emissions from energy consumption fell by 2% in 2015. An increase in natural gas used for power generation, largely replacing coal, was the primary reason for this decrease, as natural gas is less carbon-intensive than coal.
6 Comments on "Total U.S. Energy Production Increases for Sixth Consecutive Year"
Survivalist on Tue, 19th Apr 2016 8:22 pm
They don’t subtract the coal, oil and natural gas that it took to make the renewables. There’s a lot if double counting. If I produced 100 barrels of oil and burn 50 of them to farm corn and make 60 barrels of biofuel from ethanol I don’t have 160 barrels. I have 110.
makati1 on Tue, 19th Apr 2016 8:43 pm
Survivalist, you probably have a deficit as it takes more energy to produce usable biofuels.
makati1 on Tue, 19th Apr 2016 9:29 pm
I wonder what the graph would look like if they showed NET energy produced, as Survivalist mentioned? A steep decline?
Kenz300 on Wed, 20th Apr 2016 5:17 am
100% electric transportation and 100% solar by 2030
https://www.youtube.com/watch?v=RBkND76J91k
If the world is to have any hope of dealing with Climate Change we need to stop building any more coal fired power plants and begin shutting down the oldest and dirtiest ones.
shortonoil on Wed, 20th Apr 2016 11:00 am
Between 1960 and 2014 the energy delivered to the end user (the non energy goods producing sector of the economy) from a unit of petroleum has fallen by 52%; from 5.52 million BTU/barrel to 2.67 million BTU/ barrel.
During that same period the total energy delivered (from increased production) went up 12.86 times from 5.89 quad BTU to 74.90 quad.
From 1960 to 2005 production increased at an annual rate of 5.43%; from 2005 to 2014 it increased at an annual rate of 0.43%.
If the Red Queen doesn’t pick up some speed, she is going to get run over by her own butt!
Data from EtpPro-Production
http://www.thehillsgroup.org/
rockman on Wed, 20th Apr 2016 12:16 pm
And from their own chart US energy production decreased y-o-y slightly until 2006…coincident with increasing oil prices. It’s also interesting that they show the US continued to export oil even after the US oil export “ban” was passed in the 70’s.