Peak Oil is You

Donate Bitcoins ;-) or Paypal :-)
Page added on May 7, 2013
OECD Oil Consumption


Here’s a slightly more detailed look at OECD oil consumption than last week, based on the EIA monthly data. Here’s the history since 1990, broken down into three major regions (the US, Europe, and everywhere else in the OECD: Japan, Korea, Canada, Anz, etc).

Consumption peaked in 2005, fell into the great recession, recovered briefly, and then has been falling slowly again for the last three years. That last fall is at a rate of a little less than half a million barrels a day for each year:
The regional decomposition of this decline is telling:
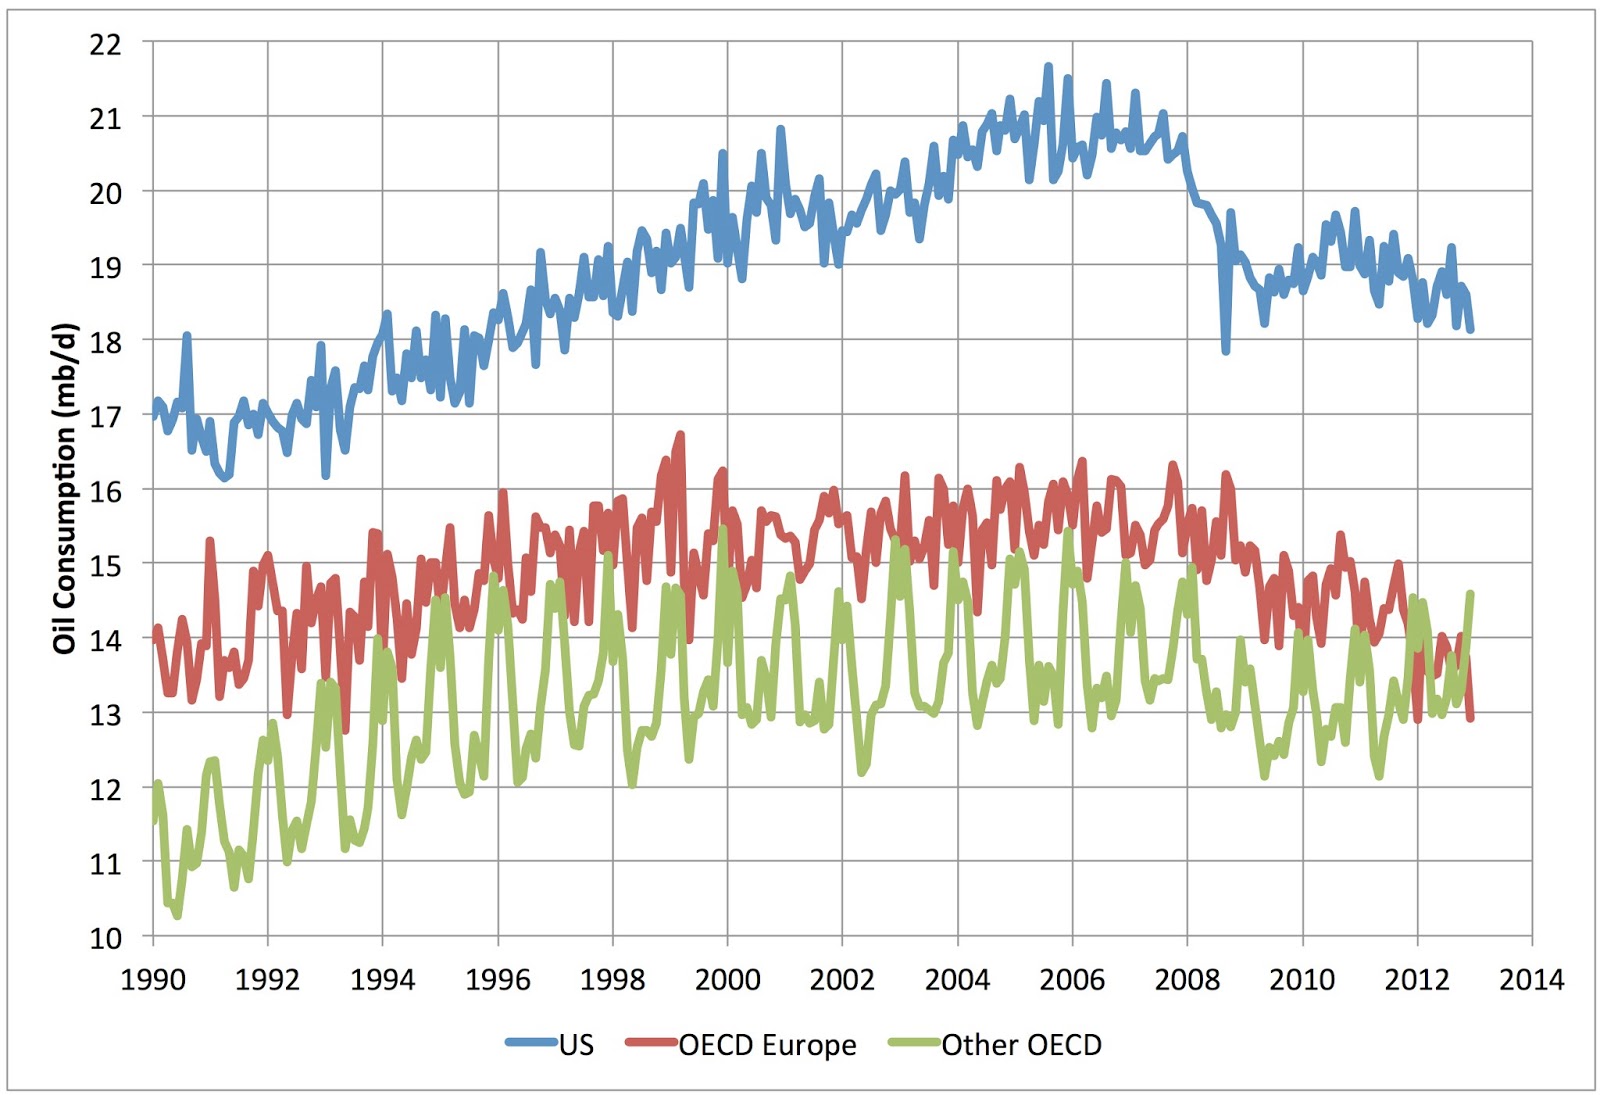
US oil consumption is falling; the US economy is growing slowly, but the US is growing more oil efficient faster than that. Europe is contracting economically, and this shows up in sharp falls in production. Meanwhile, the rest of the OECD is doing somewhat better economically and it’s oil consumption is growing.
Probably the largest prospect for a near-to-mid term exogenous change in this situation is if European policy were to turn around and become less austerity focussed so that Europe could begin to recover. That would likely slow or end the decline in European oil consumption. Of course, higher oil prices would likely drive all regions to conserve more rapidly.
4 Comments on "OECD Oil Consumption"
BillT on Wed, 8th May 2013 1:11 am
Oil efficient? Lets call it what it is … a depression where there is less money for trips to Walmart in the SUV. Decline in consumption is the new norm. How fast is the only question.
Rusty Baker on Wed, 8th May 2013 4:23 am
BillT, we are not in a depression, quite the contrary. The Dow Jones Industrial Average closed above 15,000 points yesterday, an all-time high record. Also, the boom in shale oil and gas is barely getting started, just wait til they start fracking California, China and Russia. The world will literally be swimming in oil & gas.
J-Gav on Wed, 8th May 2013 9:18 am
Rusty – Anyone who takes the Dow as a reliable indicator of economic health is playing with fire … as those presently invested there will find out to their detriment within a year. Let’s see, where did I put my sheep shears?
shortonoil on Wed, 8th May 2013 2:49 pm
“How fast is the only question.”
Since various crudes have different chemical compositions it is necessary to define what crude to answer the question “How fast”. It has been conventional crude (API 30 – 45) that has provided the bulk of the energy used to power the world’s transportation machinery for the last century. Lighter crude (API > 45) have lower per unit energy densities, heavier crude (API < 30) require more energy to process. Conventional crude provides the "energy window" that is needed to drive the world's economies.
From a volumetric perspective, conventional crude production is now falling at about 1% per year. Mainly because of increasing well depth and increasing water cut, from an energy point of view (which is the critical metric) it is falling at 2.6% per year. Both of this quantities are accelerating. By 2025 the energy metric will be declining at 25.5% per year.
As economic conditions are to trade, as trade is to transportation we can expect a significant decline in the world's economic activity over the next decade.