
Lately there has been some suggestion that “Peak Oil is dead” — that because of the recent drop in demand and price for oil, we will never again see high oil prices and will never run out of oil.
What this conclusion misunderstands is that it’s not about running out of oil, it’s about running out of oil that our economy can afford to extract. If oil cost a million dollars a barrel to extract, we would never have mined most of it, the industrial revolution would have stalled a century ago, and human societies would quickly have reverted to a subsistence local agrarian existence with a much smaller human population and much, much less industry and technology.
Oil was a remarkable discovery. Each barrel replaces the equivalent of about 6 person-years of unassisted manual labour. Our industrial economy and global civilization have been built on the ability to employ cheap oil to do the work of billions of people for next to nothing. We continue to depend on that. Our GDP growth correlates precisely with the consumption of oil, and has essentially nothing to do with innovation, technological ingenuity, economies of scale or ‘doing more with less’. When we run out of affordable oil, the game is up.
What is ‘affordable’ depends a lot on the health of the economy and on the incremental cost of extracting each harder-to-get barrel of oil. For most of the last half century, what was affordable was somewhere between $30-60/barrel. When oil prices have soared to the $100/barrel level, the economy has almost immediately started to tank.
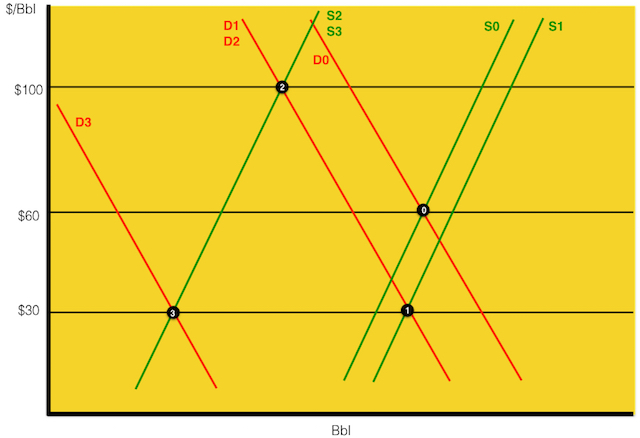
The chart above shows the supply/demand curves for oil, in general terms, over that 50 year time and, most likely, the 50 years to come. It’s a bit oversimplified because supply and demand is also affected by stocks in storage, but the amount of oil that can be reasonably stockpiled to cushion again price shocks is pretty small — certainly not years’ worth.
‘Business as usual’ over the last 50 years is shown by the supply/demand curves labeled S0 and D0, intersecting at around $60/barrel. This is a price that historically has been high enough to allow continued exploration but is low enough that consumers and industry can afford it and still make a profit (and not go into unrepayable debt). When OPEC (or political events) have conspired to constrain supply, the supply curve has shifted over to the S2 curve, and demand has necessarily been reduced to the D2 curve, leading to a $100/barrel price (where S2 and D2 intersect). This has proven to be an unsustainable price, and political pressures (i.e. wars, and threats to OPEC partners) have always been applied when the price has reached this level to get suppliers to pump more oil and move the curves back to the S0/D0 $60/barrel level.
But it’s a difficult balancing act. As cheap (inexpensive to extract) OPEC oil rapidly diminishes, and as the remaining oil becomes more expensive to extract (e.g. tar sands, fracking), the point is reached where $60/barrel is no longer enough to warrant continued exploration. And, as we saw in 2008, whenever our teetering, debt-laden (and cheap oil dependent) economy falters, and demand falls even slightly, the price can plummet to the point where even more traditional exploration and extraction become uneconomic. At this price the economies of many OPEC countries also start to unravel, many of which are politically unstable to begin with.
So let’s look what happened over the past year, when the price plummeted to the $30 level. Here are (again somewhat simplified) the factors that led to this:
- The US, seeking to stimulate an economic recovery after the 2008 debacle, and seeking to punish Russia for its global political and economic muscle-flexing, conspired with the Saudis to increase the short-term supply of oil (we may never know what the Saudis got in return for this devil’s bargain). First world nations also increased their already-massive subsidies to the oil industry to encourage fracking. The combination of these two factors shifted the short-term supply curve to the right (increased short-term supply) from S0 to S1.
- At the same time, much of the first world was mired in an ongoing recession that gutted the middle class and reduced available spending. Already at their limits in debt, consumers were forced to reduce consumption. Even as price started to drop as a result, they have chosen to pocket the savings at the gas pump to pay off debts or for other needed spending (the real, double-digit inflationary cost increases in health care, healthy food, good education and other essentials, for example). To add to this demand contraction, the artificially-stimulated Chinese economy ran out of steam and has started a long and painful collapse. The combination of these factors shifted the short-term demand curve to the left (reduced short-term demand) from D0 to D1. The intersection of S1 and D1 is the recent, depression-level price of $30/barrel.
This was a ‘success’ in terms of devastating the oil-dependent Russian economy (which requires much more than $30/barrel to be a viable producer due to their extraction costs, which are much higher than the Saudis’). It also devastated the less-oil-dependent Canadian economy and Canadian currency (which fell from above-par to 69 cents to the US dollar as a result). It quickly destroyed the fracking industry and has seized up almost all of the projects to produce more expensive oil (the Tar Sands, deep sea, Arctic etc.). So now there’s a huge short-term surplus of supply (there is no place to put any additional surplus), but the longer-term supply (which requires a price of at least $60/barrel steadily increasing to $100/barrel and beyond to develop economically) looks to be collapsing.
On top of this, the disastrous economic policies of the last 50 years, trying to squeeze out a few more years of ‘growth’ in the industrial economy by artificially lowering interest rates to approximately zero, to get consumers to buy even more by going even deeper into debt, have reached the end of the line. They have not and do not appear capable of working any more. We have reached the point at which the ‘real’ cost of oil, needed to power GDP ‘growth’ and enable the globalized industrial economy to continue, is now higher than the exhausted, debt-ridden, artificially stimulated global economy can afford to pay.
What this will mean is that in future, in a whipsaw fashion, we are going to see a combination of spikes and collapses in oil price, in a cycle that will end in both global economic collapse and the end of large-scale oil production and hence our oil-fuelled industrial culture.
First, we will see some brief and unsustainable resurgences in price, from the current S1/D1 curve price of $30/barrel back up to the stratospheric levels of the S2/D2 curve price of $100/barrel and beyond. This will happen as the global supply of cheap-to-produce ($30/barrel and then $60/barrel) oil evaporates. There is not much of this left to begin with, and we can’t create more of it by subsidizing oil production even more than we already do, because our economy essentially runs on cheap oil — without it there’s no money to subsidize anything.
While brief periods of $100/barrel oil will temporarily spark new exploration and development, this price is, as we have repeatedly seen, unsustainable. With $100/barrel oil, demand will inevitably and drastically shrink, even at a horrific human cost — we simply cannot afford to pay for it. So as the longer-term supply of (especially cheaper) oil shifts left (i.e. decreases) as cheap OPEC supplies are exhaused, moving supply to the S3 curve, demand will also shift left (i.e. decrease) as consumers and entire economies, unable to pay for the more expensive remaining oil, collapse, moving to the D3 curve. The intersection of the S3/D3 curves is, again, the depression-level $30/barrel price. But notice how far to the left this intersection has shifted on the chart! The recent shenanigans and economic stumbles have not drastically decreased global oil consumption (the point on the horizontal axis below the S1/D1 curves at intersection 1, relative to the point on the horizontal axis below the S0/D0 curves at intersection 0). However, the future economic and cheap-oil-supply crashes will catastrophically decrease consumption (to the point on the horizontal axis below the S3/D3 curves at intersection 3).
Intersection 3 is the end game for the global industrial growth economy and the globalized civilization that depends on it. It is not the passing of Peak Oil as Hubbert might have envisioned it, since there will be lots of (expensive to extract) oil left in the ground (good news for climate change, though almost certainly too little too late to stave off the end of our planet’s long stretch of stable climate).
What intersection 3 represents is the passing of Peak Affordable Oil. As this complex interplay of economic factors works its way through in the coming decades, we’re going to see some whipsawing in oil prices (and prices and levels of just about everything else) between hyper-inflationary, and deflationary, Long Depression levels. This will be the hallmark of the Slow Collapse of industrial civilization. Get ready for a rough and uneven ride.
twocats on Tue, 22nd Mar 2016 12:47 pm
The system is only in danger when on the margins – either oil prices too high or too low.
With the recent price swing to above $40 and the ongoing persistence in production (assuming that its not all just a big circle jerk cycle of oil being produced to roduce more oil – so my gas station is going to run dry any day now? Right?), the system has shown resilience to low oil prices.
Shale producers will probably show that they can cover any shortfalls in production in the short term (next couple of years). How long they can keep this up is part of the debate. Looks like until 2018 – 2020 is becoming a consensus range.
It could be a very long two years for doomers waiting day in day out for collapse.
There are at least a couple of potential hiccups to this outlook. If shale sector bankruptcies continue to accelerate (as they did in February – hitting highest rates yet!!), could send contagion through economy, with unpredictable results.
Another possibility is the $40-$50 goldilocks range is not maintained (Doha talks breakdown, Iran pumps at quickly increasing rates), putting the economy back on a downward trend
(I know a lot of people will say GDP is still growing, but I think under the headlines most industrial indexes from manufacturing to services are extremely weak, wavering at zero, and that any gains are essentially marking inflation itself – i.e. the rising cost of oil and hot money flows).
The problem with most of these hiccups is that they don’t necessarily guarantee peak oil, and have the potential of actually delaying peak oil by many years, 2025 and beyond (just as 2009 crises did).
twocats on Tue, 22nd Mar 2016 1:57 pm
here’s a good hiccup example:
http://ca.reuters.com/article/businessNews/idCAKCN0WN21I?pageNumber=1&virtualBrandChannel=0
this helps dispel the notion of “well, if they go bankrupt then someone will pick up the assets”. Not always true. Here they aren’t even putting the company into receivership, because they are afraid there won’t be enough asset purchases to cover that cost.
aren’t wells penalized for being abandoned? I know that when we sell a house the cost of back-owed utilities can become a sticking issue. It almost never kills a deal, but utility costs are relatively small compared to the value of most homes.
IFuckYouOver on Tue, 22nd Mar 2016 4:27 pm
Only stupid losers like the ones above believe that the law of supply and demand is a real law.
Show me a mathematical proof that the law of supply and demand is real or show me so scientific demonstration of the validity of this law.
Either show me a mathematical proof or a laboratory proof that the law of supply and demand is real.
Only loser argument over the law of supply and demand.
shortonoil on Tue, 22nd Mar 2016 6:33 pm
“The problem with most of these hiccups is that they don’t necessarily guarantee peak oil, and have the potential of actually delaying peak oil by many years, 2025 and beyond (just as 2009 crises did).”
Since 2013 just the extraction portion of the industry has seen its income fall by $2.3 trillion per year. If one can’t see that they are going broke, they can’t see!
Bogwood on Thu, 24th Mar 2016 1:37 pm
There is price and cost. Price has come down more than cost, cost is being paid by government and Wall Street, subsidizing consumption. Not stable.