Peak Oil is You

Donate Bitcoins ;-) or Paypal :-)
Page added on November 24, 2015
A Surprising Look at Oil Consumption

The EIA publishes oil consumption numbers for all major nations. However they have data for most nations only through 2013. They do have data for some nations through 2014. Nevertheless a lot can be gleaned from just looking at those consumption numbers. If oil consumption numbers are growing year after year, then there is a good chance that nation is growing economically. But if oil consumption numbers are continually declining year after year, then it is more than a little silly to say all is well, economically, with that nation. Or that is my opinion anyway.
First, who’s oil consumption is increasing year after year, or who’s economy is booming? All charts below are consumption as total liquids in thousand barrels per day. Some charts are through 2014 while others are through 2013. Whatever the last year is on the yearly axis is the last year for that data.
Important: All charts are consumption, not production.
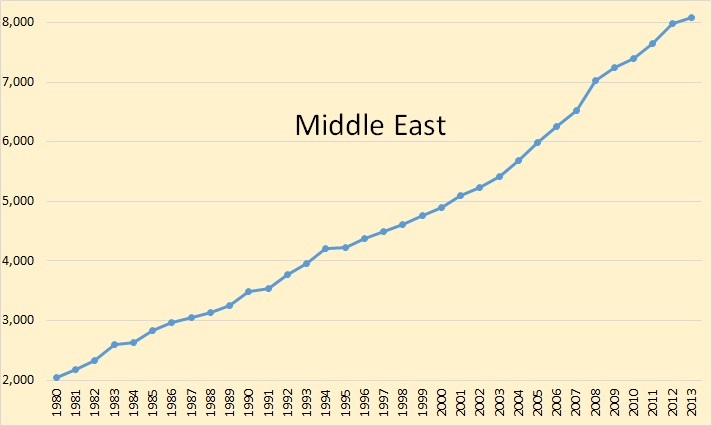
No doubt the Middle East is booming. The reason, most of them are oil producers and oil, for most of this chart anyway, the price of oil was increasing. They had lots of income, their consumption was increasing every year as was their economies.
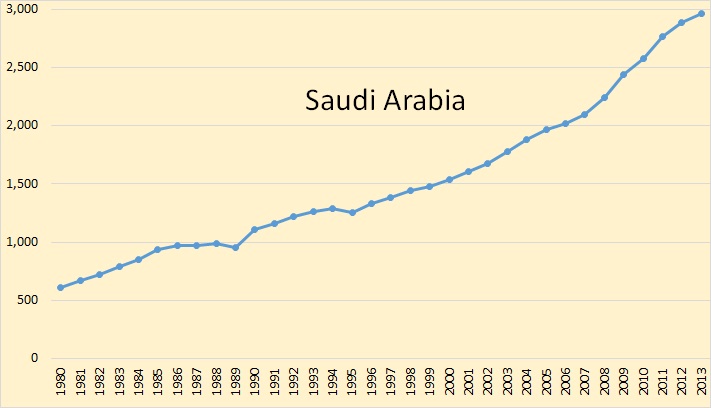
Saudi Arabia, by far the Middle East’s largest consumer, has increased consumption every year since 1995.
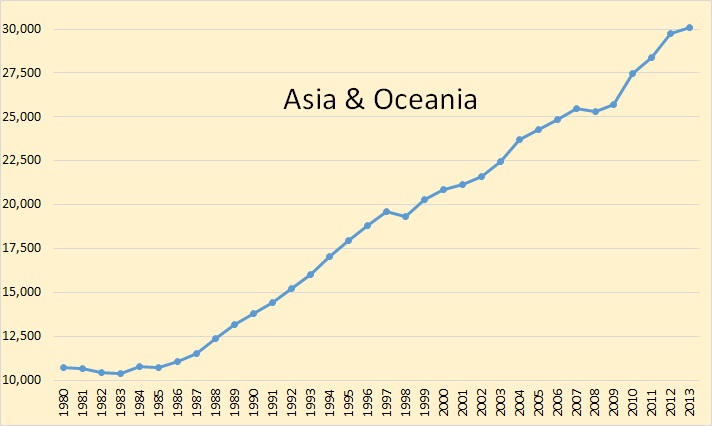
One third of all total liquids consumption is in Asia and Oceania. The area has experienced tremendous growth in oil consumption.

And Asia and Oceania’s largest consumer is China. China has increased oil consumption 6.5 percent per year since 1985.
Most of the rest of the world has not seen the consumption boom that was experienced by the Middle East and Asia & Oceania.
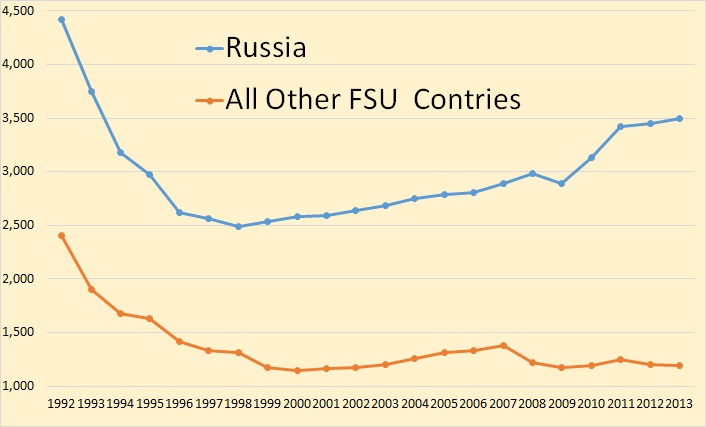
This chart dates only from 1992, the first year after the break up of the Soviet Union. Russian consumption declined by almost 2 million barrels per day to 2.5 million barrels per day during the next 6 years. Russian consumption later recovered but is still almost 1 million barrels per day below the FSU breakup point.
The combined consumption of the rest of the former Soviet Union nations declined by over 52 percent over the next 8 years and has not yet recovered.
Most of the rest of the world has seen a serious decline in consumption in the last decade.
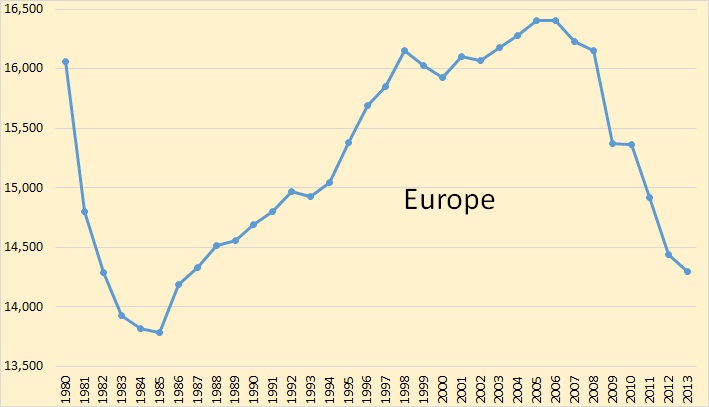
Consumption peaked for Europe in 2005 and 2006. The largest drop was in 2009. For Europe we only have data through 2013. Europe’s oil consumption is down 13 percent, 2006 to 2013.
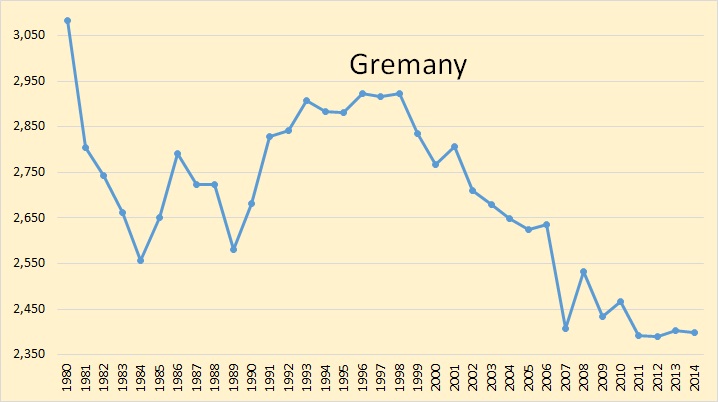
Germany is Europe’s largest economy. Germany’s oil consumption started to drop in 1999 but has leveled out since 2007. Germany’s oil consumption is down 18 percent since 1998.
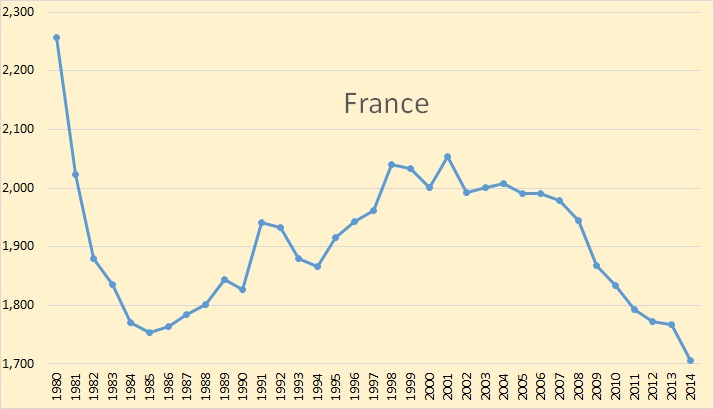
France’s oil consumption has been dropping since 2006 and really took a dive in 2104. France’s oil consumption is down 17 percent since 2001.

The UK peaked in 1996 then again in 2005. Oil consumption in the UK has dropped by just over 17 percent since 2005.
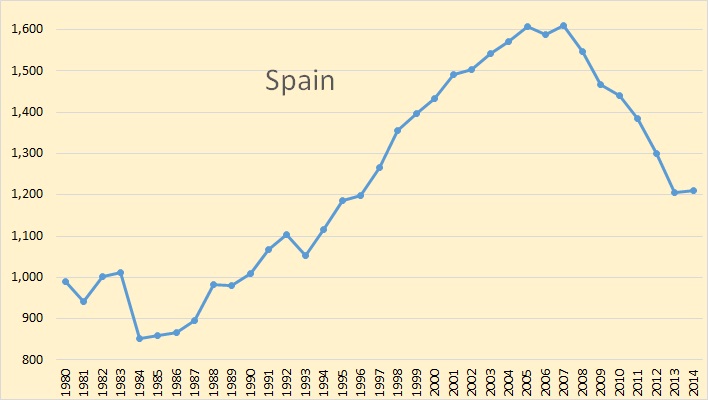
Spain’s oil consumption started dropping in 2007 but leveled out in 2014. Spain’s oil consumption is down 25 percent since 2007.

Pity poor Italy. Her oil consumption peaked in 1998 and has dropped 36.4 percent, over one third, since.
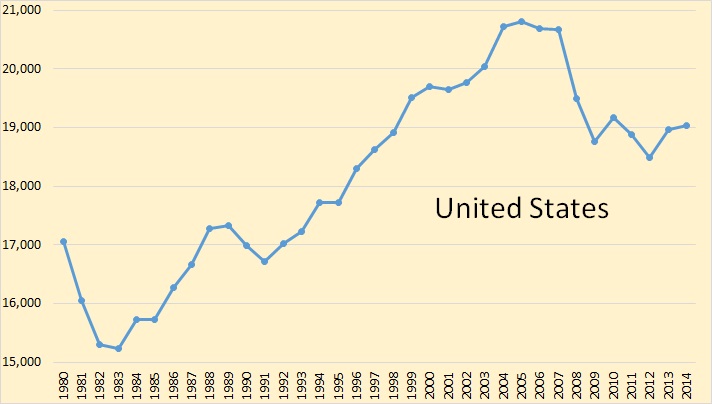
US held peak oil consumption at around 20,700,000 barrels per day from 2004 through 2007, dropped in 2008 and 2009 but has leveled out since then. US consumption in 2004 stood at just over 19 million barrels per day, down about 8 percent since the four year peak period. The recession has not hit the US nearly as hard as it has hit Europe.
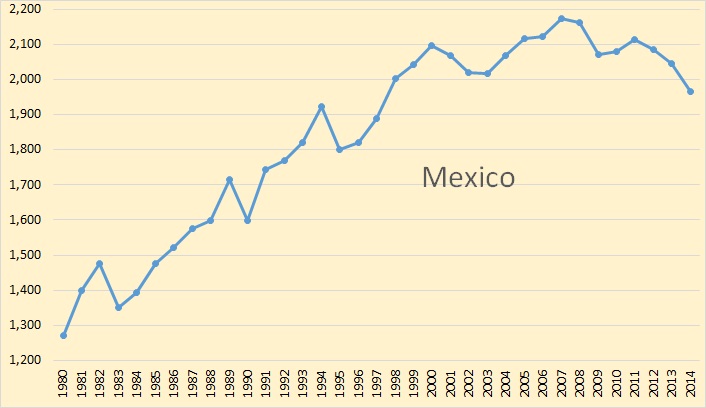
Mexico has fared better than Europe as well. Their peak consumption was in 2007 at 2,173,000 barrels per day and had declined by 9.5 percent by 2014.
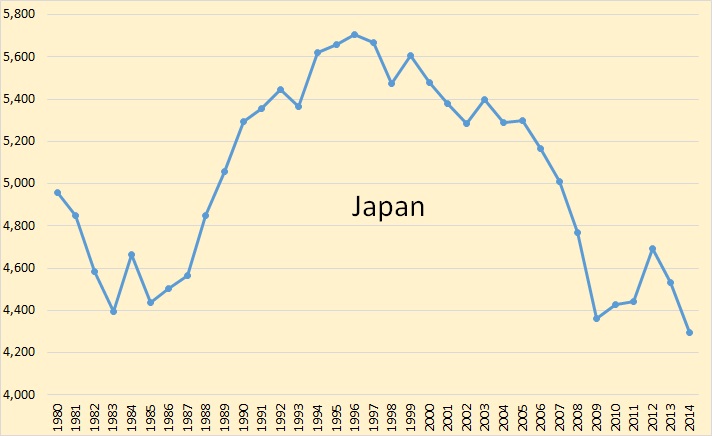
Japan has been in the doldrums for almost two decades. Their oil consumption peaked in 1996 at 5,704,000 barrels per day. They recovered slightly in 2012 but dropped again in 2013 and 2014, reaching a low of 4,297,000 barrels per day in 2014. That is a decline of almost 25 percent.
And last but not least, China has peaked, or so says the Japanese financial holding company Nomura. This chart is China oil production, past and predicted.
No turning back for China’s oil production
China’s domestic oil production likely peaked this year and is about to enter a long-term structural decline, according to Nomura. It notes the experience from Alaska’s Prudhoe Bay, which peaked in 1988: “Once the steep stage of the terminal decline output phase begins, there is generally no turning back.” The takeaway is that China could be a buyer on global energy markets next year, importing bigger volumes as it seeks to offset waning domestic production. Nomura says demand from China should help offset new supply from Iran, with prices stabilising at an average US$55 per barrel next year.
Peak Oil Barrel by Ron Patterson
10 Comments on "A Surprising Look at Oil Consumption"
rockman on Tue, 24th Nov 2015 11:37 am
The charts seem clear enough: when oil was cheaper in the past consumption increased almost everywhere. And the when oil prices increased significantly consumption declined in many regions. And now oil prices have declined significantly so what should we expect consumption to do?
Toby Grammar on Tue, 24th Nov 2015 12:41 pm
who’s=who is
whose=possessive
GregT on Tue, 24th Nov 2015 12:44 pm
“who’s=who is
whose=possessive”
Hey look, a squirrel!
Cloud9 on Tue, 24th Nov 2015 3:54 pm
You would think that a decline in prices would cause an uptick in consumption. That being said, this economy is a bit like a ball rolling down a staircase. Each time it drops to a lower level, there is a little bounce, then it levels out until it drops again. People in general are getting poorer which would reflect the on going reality of the never ending contraction.
idontknowmyself on Tue, 24th Nov 2015 4:09 pm
Here is my interpretation of these graphics from a energy point of view only.
Main nodes of the system are manufacturing, consumption, natural resources production.
Manufacturing nodes : China and Asian countries.
Oil and energy production nodes : middle-east and Russia.
Consumers nodes = Europe
Energy is moving from non-vital nodes like Europe to critical nodes like Asian, Russian and Middle-East.
Consumption in Europe go down but increasing in Russia, Asain and Middle-East
We are seeing Europe being cut-off from Energy access to save vital part of Internationale trade : manufacturing and oil extraction.
Also some of Russian increase in oil consumption could be explain be depletion: more energy is needed to extract the last oil leaving the world with less
net energy.
CAM on Tue, 24th Nov 2015 4:26 pm
The good news is that the world will burn through the surplus? Really?
shortonoil on Tue, 24th Nov 2015 5:25 pm
API inventories are out, 2.6 mb build – 9th week in a row for an increase. A decline was expected by the market; prices fell again. Questions about storage reappearing. Refined products storage problems are likely to hit the East Coast if the winter turns out mild.
makati1 on Tue, 24th Nov 2015 8:24 pm
Cloud9, right on.
BobInget on Wed, 25th Nov 2015 8:53 am
Having too much oil is like having too much money.
Ask any major lottery winner.
Still, if a person is planing to live another ten years or more, knowing the nation’s oil bank account is not empty could be reassuring.
Now, just for second, guess how youth in nations from which ‘our’ oil comes from, feel.
rockman on Wed, 25th Nov 2015 2:20 pm
Bob – 10 years??? Since 2009 US oil stocks have averaged about 1,090,000,000 bbls for 5 years. And according to the EIA stocks as of 20 Nov 2015 were 1,307,000,000 bbl. So this “huge surge” in the US oil bank account represents an additional 12 days of current US consumption. What do the financial advisers say: have at least 6 months of salary in you bank account? Then the US oil bank account should have 3,300,000,000 bbls in it. Even if you add the SPR’s 700 million bbls to the current stock the US still only has about 3.5 months socked away.
Opinions will vary, of course. But I don’t think 3.5 months vs 6 months (let alone 10 years) is going to be very reassuring to many. LOL.