Peak Oil is You

Donate Bitcoins ;-) or Paypal :-)
Page added on January 11, 2013
2013: Beginning of Long-Term Recession?

We have been hearing a lot about escaping the fiscal cliff, but our problem isn’t solved. The fixes to date have been partial and temporary. There are many painful decisions ahead. Based on what I can see, the most likely outcome is that the US economy will enter a severe recession by the end of 2013.
My expectation is that credit markets are likely see increased defaults, as workers find their wages squeezed by higher Social Security taxes, and as government programs are cut back. Credit is likely to decrease in availability and become higher-priced. It is quite possible that credit problems will adversely affect the international trade system. Stock markets will tend to perform poorly. The Federal Reserve will try to intervene in credit markets, but if the US government is one of the defaulters (at least temporarily), it may not be able to completely fix the situation.
Less credit will tend to hold down prices of goods and services. Fewer people will be working, though, so even at reduced prices, many people will find discretionary items such as larger homes, new cars, and restaurant meals to be unaffordable. Thus, once the recession is in force, car sales are likely to drop, and prices of resale homes will again decline.
Oil prices may temporarily drop. This price decrease, together with a drop in credit availability, is likely to lead to a reduction in drilling in high-priced locations, such as US oil shale (tight oil) plays.
Other energy sources are also likely to be affected. Demand for electricity is likely to drop. Renewable energy investment is likely to decline because of less electricity demand and less credit availability. By 2014 and 2015, less government funding may also play a role.
This recession is likely be very long term. In fact, based on my view of the reasons for the recession, it may never be possible to exit from it completely.
I base the foregoing views on several observations:
1. High oil prices are a major cause of the United States Federal Government’s current financial problems. The financial difficulties occur because high oil prices tend to lead to unemployment, and high unemployment tends to lead to higher government expenditures and lower government revenue. This is especially true for oil importers.
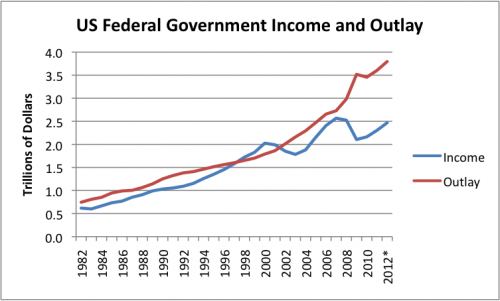
Figure 1. US Government Income and Outlay, based on historical tables from the White House Office of Management and Budget (Table 1.1). *2012 is estimated by OMB. http://www.whitehouse.gov/omb/budget/Historicals
2. The United States and world’s oil problems have not been solved. While there are new sources of oil, they tend to be sources of expensive oil, so they don’t solve the problem of high-priced oil. Furthermore, if our real economic problem is high-priced oil, and we have no way of permanently reducing oil prices, high oil prices can be expected to cause a long-term drag on economic growth.
3. A cutback in discretionary spending is likely. US workers are already struggling with wages that are not rising as fast as GDP (Figure 2). Starting in January, 2013, US workers have the additional problem of rising Social Security taxes, and later this year, a likely cutback in government expenditures. The combination is likely to lead to a cutback in discretionary spending.
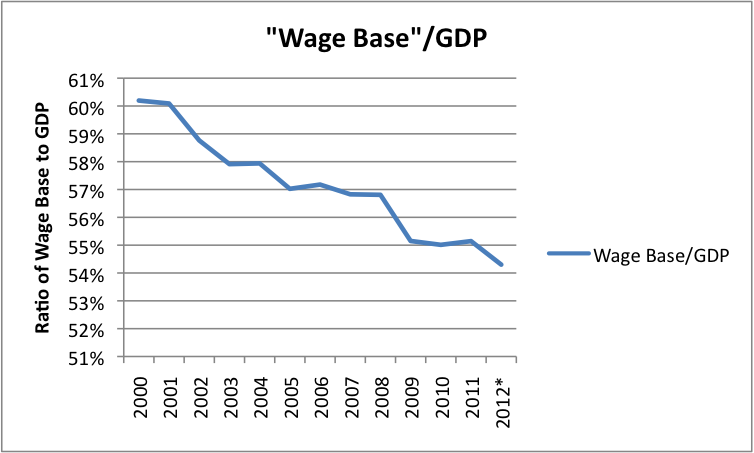
Figure 2. Wage Base (sum of “Wage and Salary Disbursements” plus “Employer Contributions for Social Insurance” plus “Proprietors’ Income” from Table 2.1. Personal Income and its Distribution) as Percentage of GDP, based on US Bureau of Economic Analysis data. *2012 amounts estimated based on part-year data.
4. The size of our current financial problems, both in terms of US government income/outgo imbalance and debt level, is extremely large. If high oil prices present a permanent drag on the economy, we cannot expect economic growth to resume in a way that would fix these problems.
5. The financial symptoms that the US and many other oil importers are experiencing bear striking similarities to the problems that many civilizations experienced prior to collapse, based on my reading of Peter Turchin and Sergey Nefedov’s book Secular Cycles. According to this analysis of eight collapses over the last 2000 years, the collapses did not take place overnight. Instead, economies moved from an Expansion Phase, to a Stagflation Phase, to a Crisis Phase, to a Depression/Intercycle Phase. Timing varies, but typically totals around 300 years for the four phases combined.
It appears to me that the corresponding secular cycle for the US began in roughly 1800, with the ramp up of coal use. Later other modern fuels, including oil, were added. Since the 1970s, the US has mostly been experiencing the Stagflation Phase. The Crisis Phase appears to be not far away.
The Turkin analysis started with a model. This model was verified based on the experiences of eight agricultural civilizations (beginning dates between 350 BCE and 1620 CE). While the situation is different today, there may be lessons that can be learned.
Below the fold, I discuss these observations further.
Issue 1. High oil prices tend to lead to government financial problems.
Food prices tend to rise at the same time as oil prices, partly because oil is used in the production of food (for example, plowing, irrigation, herbicides and insecticides, harvesting, transport to market). Also, because oil is in short supply, corn is now being grown for use as ethanol to be used as a gasoline-extender. Growing additional corn puts pressure on food prices, because it drives up the price of land and encourages farmers to put more land into corn production, and less into other crops.
The reason governments are affected by high oil and food prices is as follows. When oil and food prices rise, buyers cut back in discretionary spending, so as to have enough for “basics,” including food and commuting expenses. Workers are laid off in discretionary industries, such as vacation travel and restaurants. These laid off-workers pay less taxes, and sometimes default on loans. Governments are quickly drawn into these problems, for two reasons:
- Their tax revenue is lower, because of layoffs in discretionary sectors.
- Their expenditures are higher, because of the need to pay more unemployment benefits, provide economic stimulus, and bail out banks.
Oil importers are especially affected, because they are also paying out funds to oil exporters. The countries with well-publicized financial problems (including several European countries, the United States, and Japan) tend to be major oil importers.
Oil exporters are not adversely affected to the same extent, because they have additional revenue from higher prices on oil they are exporting. They may still be somewhat affected because of rising food prices, and the fact that higher oil revenues do not necessarily go to those buying food. A recent study shows that food shortages helped trigger the Arab Spring protests.
Part of the reason that the impact of high oil prices is as severe as it is, is because there are many follow-on effects. For example, if oil prices rise, the price of shipping goods of all types rises. If businesses are able to pass through these higher costs, discretionary income of buyers for other goods falls. If not, businesses find that their higher costs lead to lower profits. To bring profit margins back up to an acceptable level, businesses may lay off workers.
As another example, prices of homes are likely to be adversely affected by high oil prices, because a family with inadequate discretionary income will forgo moving to a larger home, and may even default on a mortgage.
It should be noted that the impact of high oil prices doesn’t completely go away unless oil prices go down and stay down. Businesses can partly mitigate the impact of high oil prices by laying off workers in discretionary segments. Some businesses will fail completely, however. Replacement may be by an overseas company, with a lower cost structure that uses less oil. See my post on energy leveraging.
Workers generally must permanently adjust their budgets to higher food and oil prices. This is often difficult to do. The lack of jobs is a particular problem–something that workers cannot fix by themselves. Government programs can mitigate the job shortfall, by paying benefits to unemployed workers and by reducing interest rates, so that businesses can more easily make investments that will lead to more employment. These programs are costly, though, and are a major cause of the current mismatch between government income and expense.
Issue 2. World oil problems have not been solved.
There have been a number of reports this years, such as one by the International Energy Agency, seeming to suggest that the world oil problem has been solved. These analyses are incomplete. They do not recognize that our real problem is a financial problem. Our economy (everything from interstate highways to electric transmission to Social Security programs) was put in place using cheap ($10 or $20 barrel) oil. Shifting to today’s high cost of oil (up near $100 barrel) causes severe economic dislocations. There is no more cheap oil to be found, however, because oil companies extracted the cheapest to extract oil first and now the “easy oil” is gone.
The impression one gets from reading the papers is that US oil production is having a huge impact on world oil production. If a person looks at the numbers, world oil production is close to flat. Rising US production makes up for falling European production, but doesn’t do a whole lot more.
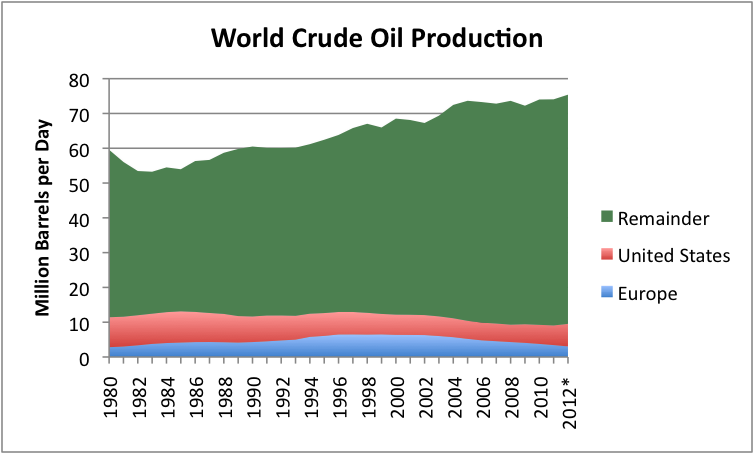
Figure 3. World crude oil production, based on EIA data. *2012 estimated based on partial year data.
The rise in United States oil production is indeed somewhat helpful, but we are still many years away from being “energy independent” and even farther from becoming “oil independent.” The real issue is high oil prices, and these are not being fixed.
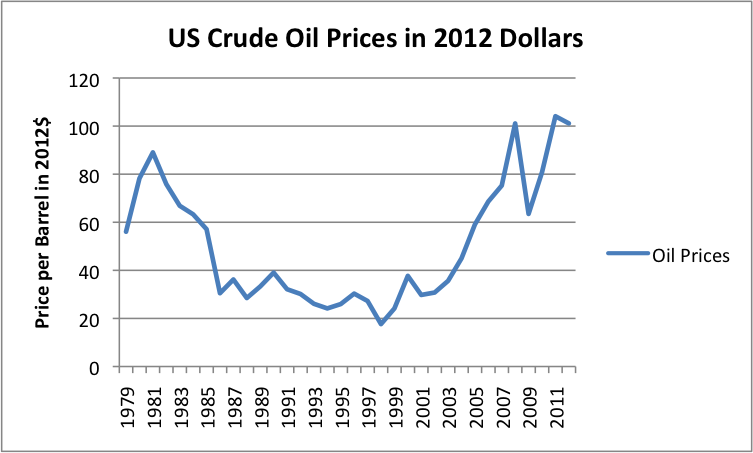
Figure 4. US crude oil prices (based on average prices paid by US refiners for all grades of oil based on EIA data) converted to 2012$ using CPI-Urban data from the US Bureau of Labor Statistics.
Our financial problems are here and now, in 2013. Promises of hoped-for higher oil production in several years at a still very high price don’t fix today’s financial problems. In fact, they will likely continue to contribute to financial problems in the future.
Issue 3. Declining wages and increased taxes can be expected to lead to a decline in discretionary spending.
As indicated at the beginning of the post, wages (including earnings of businesses owners considered as “proprietors,” but not including “transfer payments” such as Social Security and unemployment insurance) have not been growing as fast as GDP since 2000. Below is a repeat of Figure 2 shown at top of post.
Figure 2. Wage Base (sum of “Wage and Salary Disbursements” plus “Employer Contributions for Social Insurance” plus “Proprietors’ Income” from Table 2.1. Personal Income and its Distribution) as Percentage of GDP, based on US Bureau of Economic Analysis data. *2012 amounts estimated based on part-year data.
There seem to be several reasons behind this decline. One reason, already mentioned, is high oil prices leading to US layoffs, because of decreased discretionary expenditures.
Another reason for the decline is increased automation. Electricity can often be substituted for human labor, reducing costs, but also reducing jobs. Economists seem to term this change higher labor productivity. They also seem to believe that new jobs will appear from somewhere, but in practice, this is not happening. Instead, lack of jobs is part of what is leading to recessionary influences.
Another reason for the decline is increased competition from countries with lower labor costs and lower fuel costs. China joined the World Trade Organization in December 2001, and its manufacturing (and thus use of fuels) increased dramatically shortly thereafter.
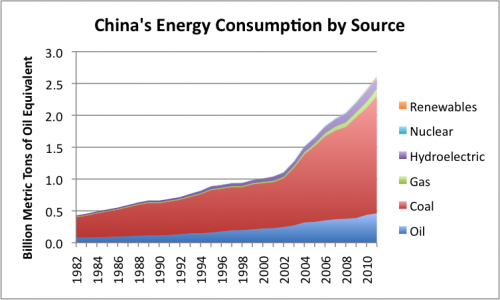
Figure 5. China’s energy consumption by source, based on BP’s Statistical Review of World Energy data.
Another reason is demographic. Baby boomers are reaching retirement age. This has already begun affecting the number of individuals who retire each year. In the future, the number of retirees can be expected to increase further.
In total, we see a very large drop in the percentage of US citizens with jobs, starting about 2000 (Figure 6). This is very close to the time that China ramped up its growth (Figure 5).

Figure 6. US Number Employed / Population, where US Number Employed is Total Non_Farm Workers from Current Employment Statistics of the Bureau of Labor Statistics and Population is US Resident Population from the US Census. 2012 is partial year estimate.
In calendar years 2011 and 2012, workers’ contributions for Social Security funding were temporarily reduced by 2% of wages, as a way of stimulating the economy. As of January 1, 2013, this temporary reduction was removed. For a couple with combined wages of $100,000, take-home pay is thus being decreased by $2,000 per year. With less disposable income, workers can be expected to cut back somewhere–buying a larger home, buying a new car, or going out to eat.
So far, only a small amount of other tax increases have been put in place, and only a few cuts have been made. More tax increases or benefit cuts will be needed later this year to bring revenue and expense into better alignment. Any such change will tend to have a recessionary impact, because citizens’ discretionary incomes will be affected.
Issue 4. The spending gap and the amount of debt look too big to be fixable without excellent economic growth.
As noted above, wages have not been keeping up with GDP. The majority of federal taxes are based on wages, so in my comparisons, I use wages, rather than GDP, as a base.
If we use the wage base from Figure 2, the amount of government outgo vs income (all levels, not just federal) is as follows:
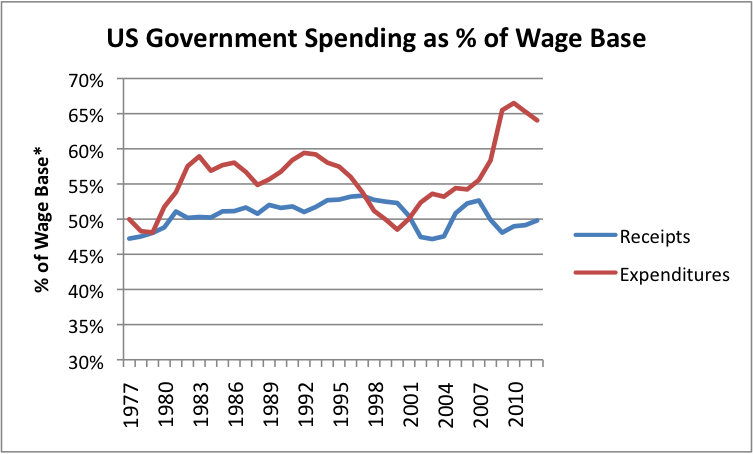
Figure 7. US Government Spending (all levels) as percentage of Wage Base, as defined in Figure 2, above, based on US Bureau of Economic Analysis data.
Based on Figure 7, the issue in recent years has been primarily rising expenditures. These higher expenditures would seem to be partly because of high-priced oil, but also because of other influences noted above that are leading to declining employment. The amount of the gap is close to 15% of wages–something that is very hard to fix. Even the current increase in Social Security taxes (“only” 2% of wages) will exert downward pressure on discretionary spending.
A related issue is that compared to wages (using the same wage base as in Figure 2), debt of all kinds is extremely high.
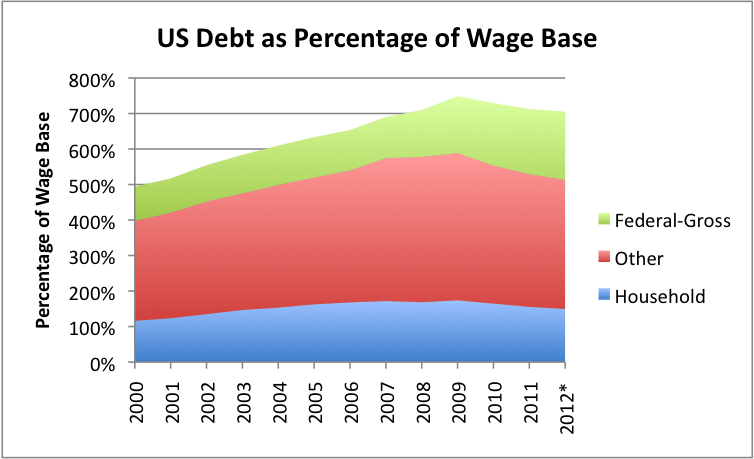
Figure 8. US Debt as a Percentage of the Wage Base, where the Wage Base is as defined in Figure 2, and Federal Debt is from Treasury Direct, and other types of debt are from the Federal Reserve Z.1 report.
Government debt is in now more than household debt of all kinds, including mortgage, credit card, auto, and student loans. It is close to two times the wage base used in this analysis.
One issue with paying down debt is that during the pay-down period, the government (or individual) reducing the debt “feels poorer,” because funds available for spending on goods and services needed today is lower. This happens because some current tax revenue, or some current wages, must be used to pay down debt, and thus is not available for today’s spending. This is a turn-around from the increasing debt situation experienced many times in the past. For example, part of the reason times seemed good in the 2002-2006 period was because people were able to refinance their homes and use the funds to buy a new car or add on a family room. If we are forced to pay down debt, we have the reverse effect.
Issue 5. Similarity to “Secular Cycles” of Peter Turchin and Sergey Nefedov.
Throughout the ages, many economies that have experienced long-term expansion. Eventually, they reached limits of some sort and collapsed. The book Secular Cycles by Peter Turchin and Sergey Nefedov takes an analytical approach to looking such past cycle. They developed a fairly complex model of what they would expect over time, in terms of trends in wages, prices, population, income inequality, and other variables. They then examine historical records (relating to eight civilizations in four countries, with “start dates” between 350 BCE and 1620 CE) to see whether this predicted pattern was born out in practice. In general, the authors found good agreement with the predicted model.
Typically, civilizations analyzed were reaching upper limits in population growth because of limits on food availability, but sometimes limits on water or fuel also were important. The model predicted four phases (expansion, stagflation, crisis, and depression/ intercycle). The typical length of the entire cycle was 300 years. The length of the various segments was fairly variable. The stagflation stage often lasted 50 or 60 years. The crisis stage tended to be shorter, more often in the 20 to 50 year range. There often was overlap between phases, with a civilization seeming to cycle back and forth between, say, expansion and stagflation.
In the model, there are various feedback loops. For example, as the number of workers rises relative to the amount of land, the price of land and food tends to rise. Jobs outside of agriculture do not rise proportionately, so wages of common workers tend to fall in inflation adjusted terms. With lower wages for common workers, nutrition declines. Eventually, the population becomes weakened, and population declines. There are also other players–the elite and the state itself.
Some characteristics of the four phases are as follows:
- Expansion phase (growth) – Increasing population, relatively low taxes, political stability, low grain prices, and high real (inflation-adjusted) wages.
- Stagflation phase (compression) – Slowing population growth, much heavier taxes needed to support a growing elite class, low but increasing political instability, rising grain prices, declining real wages for most workers, increasing indebtedness, and increasing urbanization.
- Crisis phase (state breakdown) – Population declining from the peak (typically by disease or by deaths from warfare), high income inequality, political instability increasing to a peak, high but very variable grain prices, high urbanization, tax system in a state of crisis, peasant uprisings.
- Depression/intercycle – Low population, attempts to restore state, declining economic inequality, grain prices decreasing but variable.
It seems to me that the United States and much of the world are going through a cycle much as described by Turchin. The Growth Phase of our current cycle seems to have begun around 1800, with the rise of coal use. Stagflation in the United States seems to have started with the drop in US oil production in 1970. All of the government budget and debt problems now seem to suggest that we are reaching the Crisis Phase.
Obviously, there are differences from the civilizations modeled, because we now live in a much more integrated world. Furthermore, earlier societies did not depend on oil and other modern fuels the way we do today. We do not know how the current situation will play out, but the comparison is concerning.
9 Comments on "2013: Beginning of Long-Term Recession?"
Mike999 on Fri, 11th Jan 2013 1:46 pm
This article was written Jan 6.
Did it take into account the new tax base income increases? As Krugman has pointed out, the new tax base essentially takes care of the US Deficit.
BillT on Fri, 11th Jan 2013 2:17 pm
Not a possible recession but the continuance of the depression we entered in 2008. The fact that it is being papered over by the Fed printing press does not make it go away.
econ101 on Fri, 11th Jan 2013 4:32 pm
The citizens of this country elected this government and they can live with the results. What did they expect? There is more than enough wealth in america to take care of our needs but a fiscally irresponsible governement pandering to social programs for votes and not presenting any budgets for 4 yrs is certainly a huge problem leading us down the road to fiscal pain.
GregT on Fri, 11th Jan 2013 6:17 pm
The recession began in 2008, if anything 2013 could be the beginning of the never ending depression.
Blaming the current government for this mess is like blaming your psychologist for you being 200 pounds overweight.
Rusty Baker on Fri, 11th Jan 2013 8:38 pm
This is precisely the politics of peak oil. Producers artificially lower production in order to warrant high prices pf crude. The truth is that the earth is flooded in oil, we have at least a 1000-year supply at current rates of consumption. America could easily become energy independent if it wasn’t for the Communist policies of the EPA and liberals in Washington. According to my estimates (which are based on sound science), if we opened more federal land to drilling and removed all environmental regulations , USA would be producing 26.5 million barrels a day of pure American light sweet crude in the forseeable future. Moreover, The price of a barrel could conceivably drop to 11 dollars a barrel, thus ushering a new golden age of industrial civilization. Don’t fall for the “peak oil” hype. In addition, it has been proven that M. King Hubbert was a Communist infiltrator who corrupted the American geophysical sciences with funding provided by his Soviet and Maoist sponsors.
Arthur on Fri, 11th Jan 2013 8:38 pm
“Blaming the current government for this mess is like blaming your psychologist for you being 200 pounds overweight.”
You can blame any US government after Clinton, the last president running a surplus, due to yuppie entrepreneurial spirit / IT & dotcom / USSR peace dividend / increased trade due to globalisation / for not adapting to reality and abandon this desastrous ‘full spectrum dominance’ idea.
Rick on Fri, 11th Jan 2013 9:07 pm
“This recession is likely be very long term. In fact, based on my view of the reasons for the recession, it may never be possible to exit from it completely.”
Wrong.
What we are in, and the world (China included) is a contraction. A permanent contraction. And this started long ago, and now with global peak oil in 2005, the contraction is speeding up.
Though, this is going to be a very long contraction, like JHK and Greer will tell you.
Pacman on Fri, 11th Jan 2013 10:09 pm
Seems like an analysis of the present situation that matches much of heinbergs predictions of 10 years ago in ‘end of suburbia’
This recession will end it has to but theoretically it could take 200 years At some point the human/earth equation will balance enough for growth to return but at a rate closer to what it was like pre oil
Anonymous on Fri, 11th Jan 2013 11:36 pm
@Rusty Baker where you did you read we have 1000 years of supply?, please don`t say it comes from your imagination.