Peak Oil is You

Donate Bitcoins ;-) or Paypal :-)
Page added on December 8, 2010
Fundamentals Matter, Or, Why Oil Prices Are Way Too High

Am I taking crazy pills, or am I the last oil analyst to think the fundamentals matter? With oil cresting to $90/bbl Tuesday morning, it sure doesn’t seem like investors are paying much attention to fundamentals. It seems the trajectory of the US dollar and technical indicators are having more influence on crude prices than anything remotely related to the economic realities of supply and demand for crude. The fundamentals caught up with natural gas prices, and I argue they will catch up with oil prices, too.[1] I have yet to see a compelling fundamental case for crude prices at these levels. If you have one, please send it to me. My apologies in advance for the ugly charts.
Inventory Levels
Inventory levels are the most widely followed fundamental for commodities such as oil and oil products. Declining inventory levels mean demand is outpacing supply, which enables suppliers to charge more for the underlying commodity because of its increasing scarcity. Conversely, when inventories increase, it means supply is outpacing demand, which normally results in a lower price of the underlying commodity as increased availability of supply enables buyers of the commodity to negotiate lower prices from suppliers. It sounds intuitive, but it doesn’t appear that investors think the same logic holds for oil.
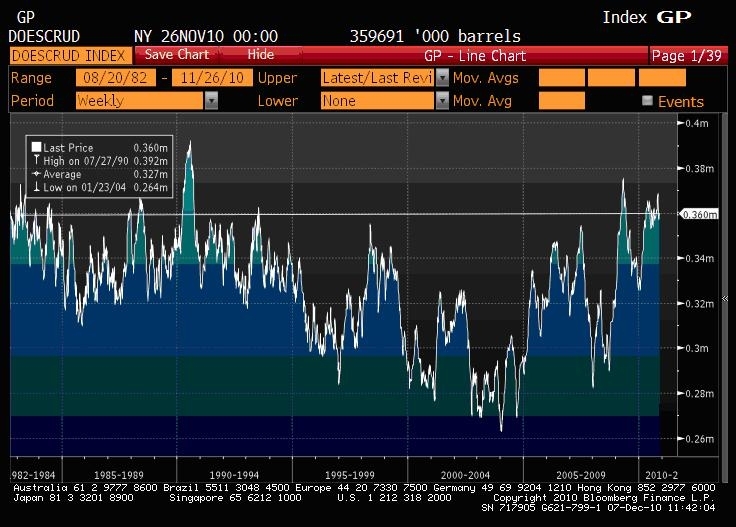
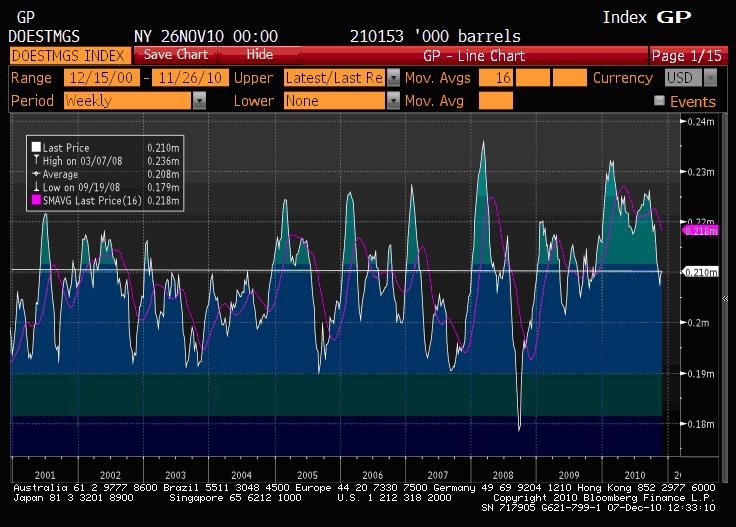
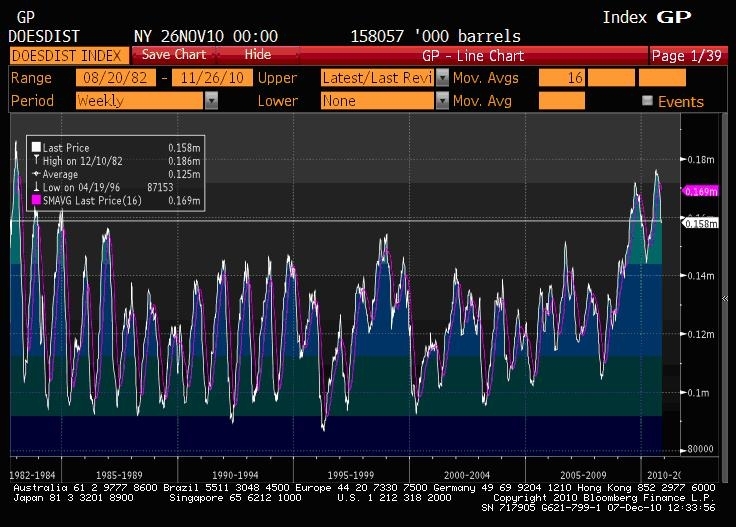
The US is still the world’s largest oil and oil products (gasoline, diesel, heating oil, etc.) consumer at 19 million barrels per day of crude, which is just under 22% of world demand. While China gets most of the press, it accounts for less than 11% of world demand. Given the economic weakness we’ve seen over the last two years as well as consumer conservation efforts, demand for oil has fallen approximately 7% from its peak in 2007. This has resulted in inventory levels for crude and oil products to build substantially here in the US. We have crude inventories that we haven’t seen since the early 90’s and distillate inventories that we haven’t seen since the early 80’s. Gasoline inventories are in-line with the recent average but were recently at highs not seen since the late 90’s. We have ample oil, gasoline, and distillate supplies to meet our domestic needs in a 3-4% GDP growth scenario.
US Crude Oil Inventory Levels(Excluding the SPR[2])
click to enlarge
US Gasoline Inventory Levels
US Distillate Inventory Levels
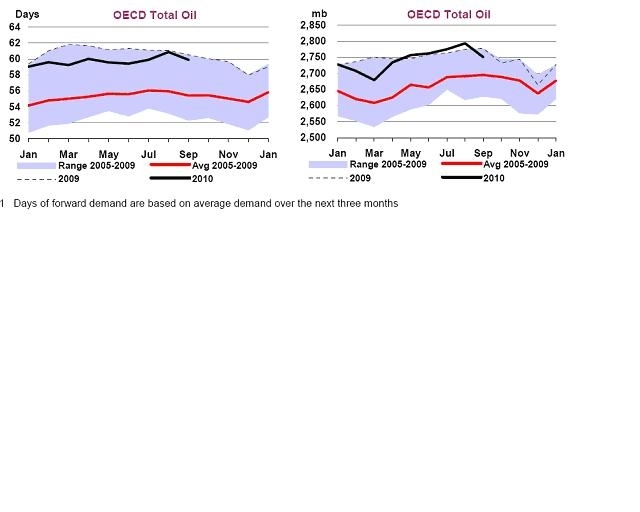
While the United States is the largest single consumer of oil, oil prices are set by a global market, so I will now direct your attention to the data we have for global inventories. The International Energy Agency (IEA) keeps tabs on the supply, demand, and inventory levels for the developed nations of the world.[3] These nations account for 52% of global demand for oil and oil products. Similar to the US, demand from the developed world is still down 4.5% from its 2007 high, which has led to a substantial increase in global inventories of crude and crude products as the chart below demonstrates. We currently have 10% more global inventory of crude products than we did back in 2004 when crude prices started their march higher.
OECD Total Oil Products Inventories
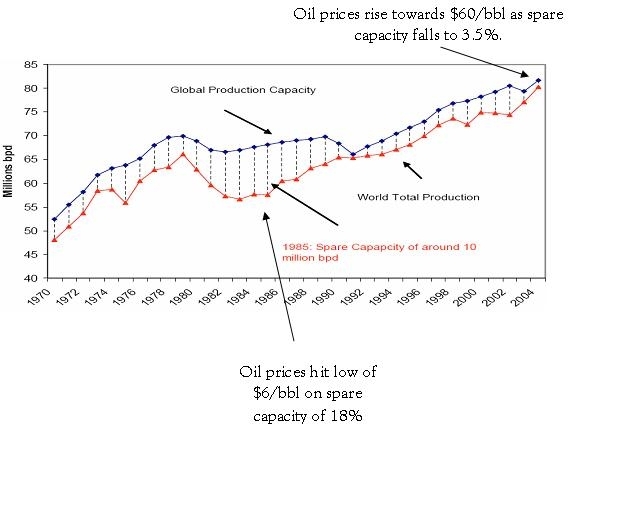
Global Spare Capacity
Another fundamental metric that oil analysts follow (or at least used to) is global spare capacity. Spare capacity is the amount of incremental production that OPEC and Non-OPEC producers can increase to offset supply disruptions or demand surges. Historically, having spare capacity of 5% or more has been considered an adequate cushion. Excess capacity of 18% killed the last oil cycle in the mid-80’s after a supply response from record prices in the 70’s met lower demand from a global slowdown in the early 80’s and demand conservation efforts. Back in 2004, when China’s demand surged 14.5% a year after Iraqi Freedom knocked 1 million barrels of production offline, spare capacity fell to 3.5%, and crude prices broke out of the $10 – $35 trading range they had maintained for over twenty years. While the exact number of barrels that can be brought online quickly or sustainably is difficult to pin down, the International Energy Agency estimates current spare capacity to be 5.5 to 6 million barrels. Current global oil demand is running at 87.3 million barrels per day, so that implies that spare capacity is 6.3%, using the 5.5 million barrel estimate. When spare capacity in 2001 was 6.5%, crude prices average $25/bbl. Using the IEA’s forecast for global demand in 2011 of 88.4 million barrels per day, a 5% global decline rate assumption[4], and 3.1 million barrels per day in new start-up projects slated for 2011, I estimate spare capacity will rise to 8%, which should be extremely bearish for crude prices.
China
China’s insatiable demand for commodities is often cited as one of the biggest drivers of oil prices. China is responsible for 33% to 40% of all demand growth since 2003. China’s rapid industrialization and, especially auto production, underpin China’s appetite for oil among other commodities. However, despite average annual demand increases of 8% over the last five years, China is still just 11% of world oil demand, and I argue the tail can’t wag the dog. The OECD nations represent 52% of global demand, and, as mentioned above, OECD demand is still 4.5% below 2007 levels. With recent woes in Europe and high levels of unemployment here in the US, it’s difficult to see demand for oil returning to 2007 levels next year.
In addition, China is aggressively trying to rein in inflationary pressure by raising interest rates and reserve requirements for banks, which should slow GDP and consumption of oil. In addition, China’s centralized commodity purchasers have proven shrewd at backing away from buying commodities when prices are high. The International Energy Agency is still forecasting 9.6% GDP growth for China next year and 4.2% growth in China’s demand for oil, which I’m incorporating in my model. I don’t think China’s growth in 2011 will be enough to offset the continuing drag in the rest of the global economy, and I don’t think China’s demand alone is a sufficient argument for lofty crude prices.
What Else Could Be Driving Crude Prices?
The falling US Dollar? The US dollar is clearly driving a large portion of the price action in oil prices with some investors shorting the dollar by buying crude futures contracts. I ran a five-year regression on crude vs. the trade-weighted dollar index (DXY). The R-square was 55%, T-test -17.94, and the standard error was 13.86. Thus there is evidence of a statistical relationship; however, I wouldn’t use the model alone given the large confidence interval the standard error creates. However, I have been incorporating a US dollar outlook into my analysis (begrudgingly) for the last couple of years.
Marginal cost? Some investors will point out that the marginal cost of production will keep oil prices higher. I agree with this view, and I think the marginal cost of production is close to $70/bbl. Some sell-side analysts put this figure much higher, but most deepwater, oil shale, and oil sand new development and production costs that I see are $70/bbl or less. Service costs increased rapidly in 2008 but have since come down quickly. Supply shortages in rigs and manpower have largely been alleviated, and the marginal cost of production has likewise fallen since then. If oil prices fall far below $70/bbl oil, higher cost drilling projects will be delayed or canceled, which will eventually lead to demand outpacing supply again and buoy prices higher. However, as we have seen with natural gas, supply cuts may not come quickly enough to support prices.
Geopolitical risk? Geopolitical risk is certainly real, but impossible to forecast. I gave up forecasting hurricanes long ago. Undoubtedly, If Israel bombs Iran tomorrow, oil is going to $100. However, I have no way of incorporating this into my analysis other than to see how much spare capacity there is to absorb a supply shock. With 5.5 million barrels of spare capacity, we can lose all Nigerian production twice over and still meet demand needs by ramping up excess OPEC production capacity.
Speculators? I think large passive index investors and speculators are keeping oil prices artificially high. The financial crisis of 2008 was largely caused by a lack of liquidity as counter-party risk soared and short-term lending evaporated. The crude futures market did not buck the trend. Oil prices hit $147/bbl in July of 2008 and ended the year under $40 as investors exited their positions. The CFTC is currently reviewing margin requirements and position limits to non-commercial holders of crude futures. If the CFTC decides to adopt harsh measures, liquidity will once again come out of the market, and prices will fall. I think this is a risk many speculators and/or passive commodity investors aren’t paying much attention to. I also think the passive index investors such as pension funds and insurance companies may reduce their energy allocation weightings as they realize the diversification benefits of owning oil is now is much less given crude’s recent 67% correlation with the S&P 500 vs. -38% when this argument was first being pitched on Wallstreet back in 2003.
Put Your Money Where Your Mouth Is
My own estimate for 2011 is an average price of $74/bbl, which is well below the $86/bbl consensus. I’m assuming the trade-weighted dollar remains range bound around its five-year average of 81.5, and that real global GDP growth is 3.5% in 2011. While I think a higher oil price is justified to find and develop new resources, I think we may be beginning to see a replay of the 80’s where the supply response catches up to demand weakened by a global recession. I have been aggressively shorting crude futures above $80/bbl, so my money is where my mouth is.
[1] The opinions offered in this article are not necessarily the opinions of ZWJ Investment Counsel.
[2] Strategic Petroleum Reserve
[3] Organization for Economic Co-operation and Development (OECD). Membership is mostly North America, Europe, and developed Asia.
[4] Estimates on decline rates range from 4.5% to 7%. My own analysis shows them tracking sub-5% over the last couple of years.
2 Comments on "Fundamentals Matter, Or, Why Oil Prices Are Way Too High"
Paul Marsilio on Thu, 9th Dec 2010 2:50 am
In looking at your 2011 spare capacity calculation, assuming 5% depletion would result in approximately 4 mbpd.
Increase demand of 1.4% results in addtional 1.2 mbpd. You state that 3.1 mbpd of new productin is scheduled to come on line. In summing this up, I see a net decrease of 2.1 mbpd which would bring spare capacity down to 3.4% by the end of 2011. Perhaps I’m missing something – could you please explain how you calculating 8% spare capacity?
Kenz300 on Fri, 10th Dec 2010 10:37 pm
China and India each with a billion plus populations will be driving the growth in energy consumption for a long time.
The worlds population growth has met it’s match in the worlds limited supply of resources.
It is only a matter of time before world demand exceeds world supply increasing the price for all.
We can sit and wait until it happens and then react and complain or we can begin the transition now and try to reduce the impact of those higher prices.
The introduction of biofuels into the energy mix has replaced a portion of oil going into transportation fuel. That helps to stretch the supply of oil, reduces the demand, and helps keep the price of oil down.
Bring on the electric, flex-fuel and hybrid vehicles.
Diversify…. diversify…. diversify