Peak Oil is You

Donate Bitcoins ;-) or Paypal :-)
Page added on December 11, 2016
EIA’s Lack Of Math And Logic Skills Makes For An Interesting Investment Environment

Summary
EIA recently released the 2016 Annual Energy Outlook.
I look at EIA’s past projections and compare with reality.
What does this mean for an Energy Investor?
Every year EIA releases an Annual Energy Outlook. Here are the projections from the 2016 EIA Annual Energy Outlook expressed as a percent of total power generation.
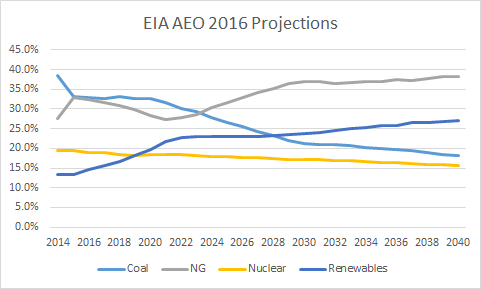
Source for all AEO charts: EIA Data Browser
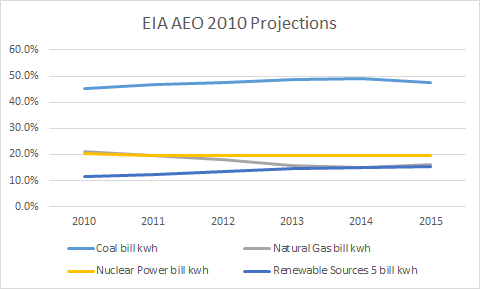
Basically EIA projects that renewable growth will slow down after 2020 and natural gas growth will accelerate. EIA presented several scenarios and the above is their reference case. 2016 is the most radical reference case presented by the EIA ever. Let’s look at what EIA projections have been like in the past. Here are 2010 to 2015 AEO projections:
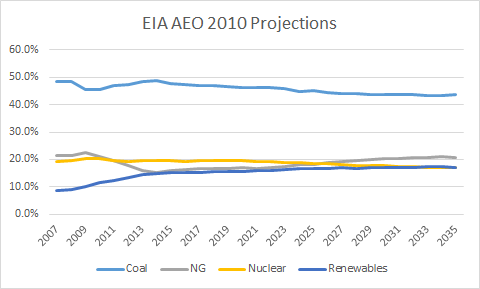
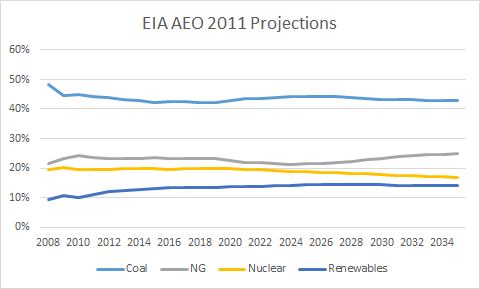
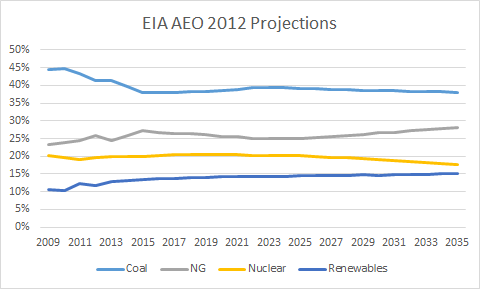
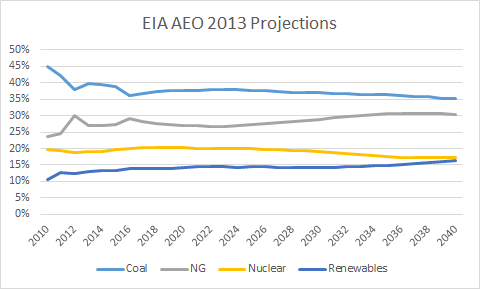
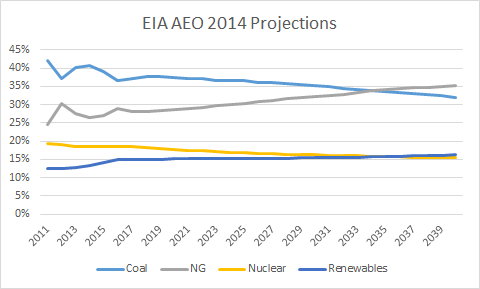
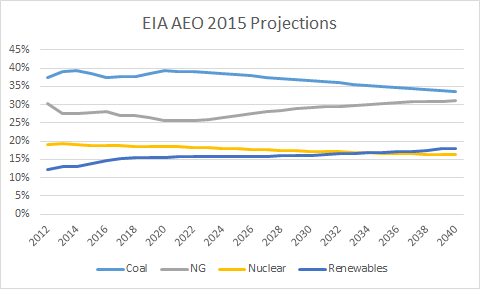
These forecasts show that EIA has been extremely conservative, to put it mildly, in their long term forecasts. In 2016, natural gas has already crossed coal as the top source of power (1087 TWh vs 934 TWh) in the US and there seems to be no looking back. EIA projected that to happen in the 2030s in 2014 and beyond 2040 in 2015. But it happened in 2016!
Look at the last 5 years as projected by EIA vs reality:
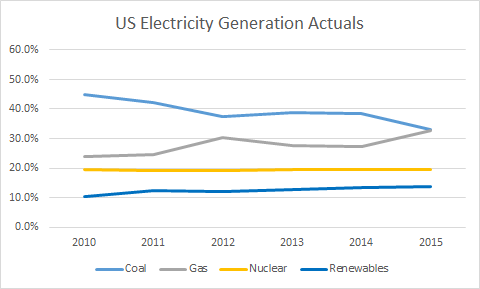
While renewables looks pretty accurate, it is because Hydro is lumped in. Let’s look at what EIA projections of Solar (thousand MWh):
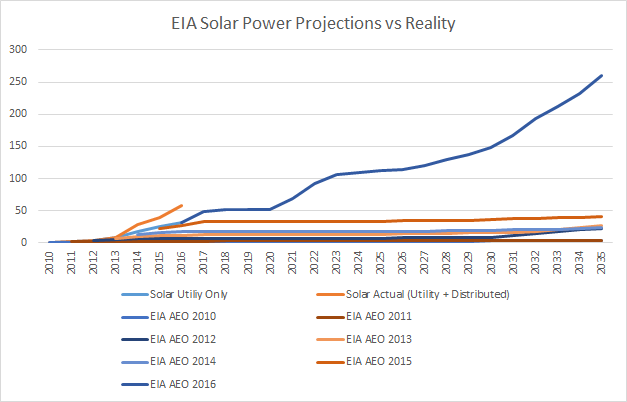
Note the dismal projections until 2016. Basically in 2016, the US is already producing more solar than the EIA had been projecting in 2035.
Let’s look at a close-up of just the last few years and into the future up to 2020:

Source for Actuals up to 2015: EIA 2015 Annual Summary Statistics
2016 Utility Solar assumed to be same as AEO 2016 and utility + distributed projected from EIA Electricity Monthly
EIA projections have been so bad that they were even wrong in the year they were made! That is how fast solar has been growing.
While the long term projection for Solar looks reasonable in the AEO 2016 in the chart up to 2035, the short term projections by EIA from 2018 to 2020 look like 0 growth for utility scale solar. Pretty much the opposite of the actual trend:
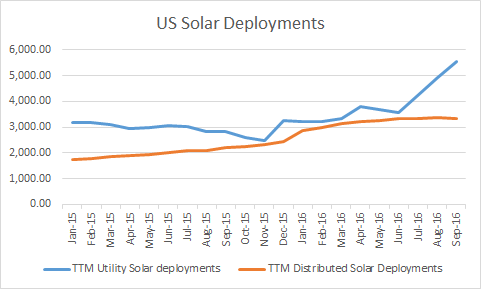
Source: Electric Power Monthly
Short term, it seems like the growth of distributed solar has flatlined, possibly from net metering battles, such as the one in Nevada which killed distributed solar and caused companies like SolarCity (NASDAQ:TSLA) and Vivint (NYSE:VSLR) to leave one of the sunniest states in the nation.
Utilities on the other hand are deploying more solar than the wildest dreams at EIA.
While I have focused on solar above, the lesson for an investor is that EIA forecasts are pretty much useless. So if you are deciding to invest in natural gas pipelines or renewable energy companies or utilities based on projections by EIA, think again.
So why are EIA projections so bad? Is it stupidity, ignorance or corruption? My answer is none of the above. The EIA has on what I call Insider Blinders™. Basically industry insiders unable to fathom disruption. We see it happen all the time. Digital Cameras, Electric Cars, Smartphones controlled by fingers – all deemed expensive toys that will never work only to radically change the industry. Solar power is basically doing the same to the energy industry from an expensive toy source of power to the fastest growing source of energy worldwide.
Even now, the EIA thinks that from 2018 – 2020 solar will stop growing and then again from 2023 – 2026. If we think about that for a moment – the last few years represented very low natural gas prices:
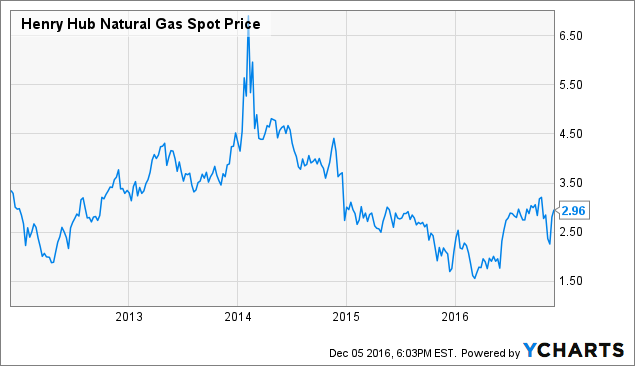
And yet solar deployments continue to rise and solar pricing continues to fall. Soon natural gas might get as uneconomical as coal. Or the next administration can take steps to prevent that from happening over the short term. In any case, the energy industry is moving so fast that making any sort of informed choice based on projections by experts is of no use.
The solar boom hasn’t helped Solar company stocks with the Guggenhiem Solar ETF (NYSEARCA:TAN) down over 45% in three years. Nor has the natural gas boom helped with the Aleriam MLP ETF (NYSEARCA:AMLP) down 30%.
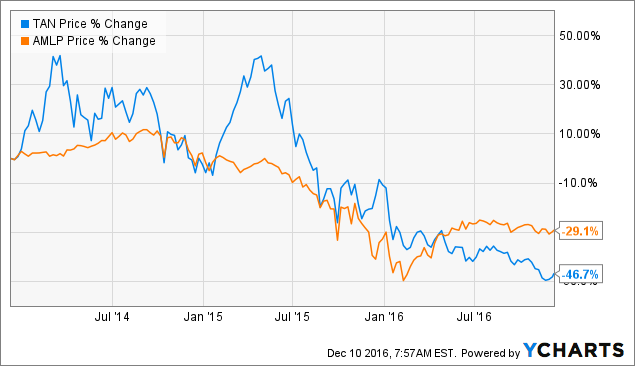
In the same time frame the markets have surged:
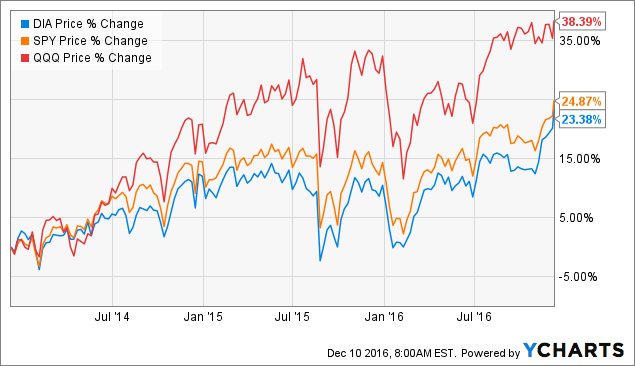
Has cheap solar and cheap natural gas benefited the utilities?
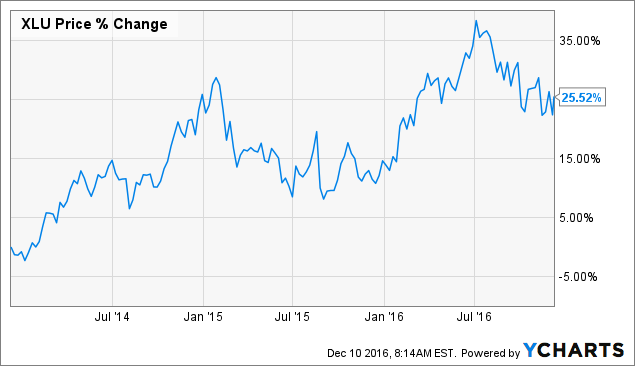
The utilities have basically returned same as the markets over the last three years but a closer examination of the charts above shows utilities falling since July while the markets are rising.
The common opinion is that to have very high penetrations of intermittent renewables, energy storage needs to get a lot cheaper. Here Tesla leads the way in storage battery pricing. However with renewables like wind and solar getting increasingly cheap, the time is coming where building overcapacity and curtailing overproduction will be sufficient instead of storage. And many studies point out that storage requirements might be much lower than imagined.
To me this indicates that the days of fossil fuels, even natural gas are numbered. The demise of coal was swift thanks to the stars lining up with cheap natural gas and cheap renewables and worldwide environmental concerns. Some years from now the demise of natural gas could be even swifter if natural gas prices rise in the face of continuous drops in renewable costs. There is also the wildcard of distributed generation. If distributed generation gets cheaper than energy distribution costs for utilities and if an average energy customer can generate and store even a quarter of their electricity usage, that represents a massive decline in usage from utilities.
On the other hand the utilities have increased future usage from growing plugin vehicle market penetration.
In conclusion, we are at the beginning of an energy revolution that makes the future of energy unpredictable. Even experts are clueless. Personally, I see the US and the world going renewable at a faster pace than anyone imagines. I will not be surprised if the EIA AEO 2016 scenario for 2040 comes between 2020 and 2025. My plan is to continue to accumulate renewable energy stocks at the current bargain basement prices.
Disclosure:I am/we are long TSLA.
I wrote this article myself, and it expresses my own opinions. I am not receiving compensation for it (other than from Seeking Alpha). I have no business relationship with any company whose stock is mentioned in this article.
4 Comments on "EIA’s Lack Of Math And Logic Skills Makes For An Interesting Investment Environment"
rockman on Sun, 11th Dec 2016 7:55 pm
“What does this mean for an Energy Investor?” Doesn’t mean much IMHO. Even if the EIA’s projections were 100% correct Energy Company A (be it fossil fuels, solar, utilities, etc) might be a great investment and Energy Company B might be a dog.
If some picks a specific company to invest in based on an EIA industry wide projection they deserve to loose their ass. LOL.
Sissyfuss on Mon, 12th Dec 2016 8:58 am
“Lose” their ass, Rocko. To loose their ass means they’ve been eating too many beans around the campfire.
rockman on Mon, 12th Dec 2016 10:39 am
Sissy – Mucho thanks. I often try to remind folks what poor spelers geologists are. Often folks don’t catch those intentional screw ups. Maybe not to hurt the Rockman’s feelings. Naa…not this crowd.
Kenz300 on Thu, 15th Dec 2016 6:27 am
World Energy Hits a Turning Point: Solar That’s Cheaper Than Wind – Bloomberg
https://www.bloomberg.com/news/articles/2016-12-15/world-energy-hits-a-turning-point-solar-that-s-cheaper-than-wind
Solar cheaper than natural gas and coal.
Climate Change will be the defining issue of our lives.