Peak Oil is You

Donate Bitcoins ;-) or Paypal :-)
Page added on April 18, 2013
4 Reasons For The Massive Drop In Oil Prices

Staying with the theme of bearish sentiment in commodity markets, crude oil came under severe pressure recently. Based on today’s data, US crude inventory actually declined last week, surprising some forecasters who expected crude stocks to continue rising. One would expect lower inventories to result in higher prices, but that did not occur.
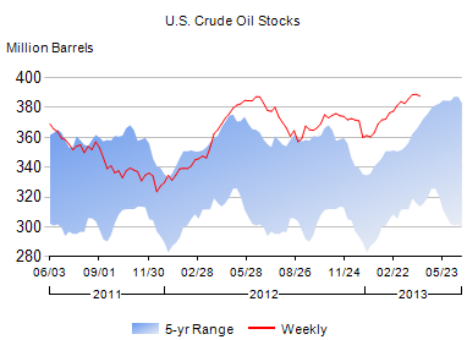 |
| Source: EIA |
Instead WTI futures took a 2% hit today, reaching a 10-month low.
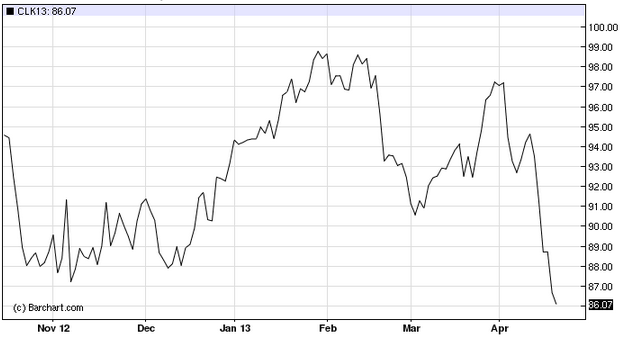 |
| May WTI futures |
Here are some of the explanations from market participants for these violent moves to the downside:
1. Weaker than expected growth in China has precipitated a negative sentiment in commodity markets (see discussion).
2. Major commodity investors such as hedge funds have been unwinding positions.
3. Today we saw what could amount to weaker than expected demand for gasoline in the US, as more drivers stay home.
EIA: – Over the last four weeks, motor gasoline product supplied has averaged over 8.4 million barrels per day, down by 3.3 percent from the same period last year.
4. The non-OPEC crude oil production, particularly out of North America continues to surprise. The Deutsche Bank chart below, showing North Dakota’s oil production, is giving some long oil investors a pause for concern (in some cases nightmares).
 |
| Source: DB |
DB: – The latest production data out of North Dakota, home to the prolific Bakken shale, reflects the strength of US production as output hit a record 780kbd in February after dipping in January as cold weather hindered operations. Production in the state is up nearly 40% YTD. According to Lynn Helms, Director of North Dakota’s Department of Mineral Resources, the state is likely to reach 800kbd in May once weather conditions improve. Helms also said the state is on track to reach production of 850kbd by early 2014. We note that if North Dakota’s production averages about 800kbd this year, which would be up from last year’s average production rate of 663kbd, this would be equal to over 70% of non-OPEC’s estimated total supply growth for this year, according to the IEA.
All this is good news from the Fed’s perspective, giving the central bank incremental room for monetary expansion. It’s unclear where the Fed-induced bubble will show up, but for now it’s not in commodities.
9 Comments on "4 Reasons For The Massive Drop In Oil Prices"
BillT on Thu, 18th Apr 2013 11:25 am
More fraking propaganda from the oil pimps. The Fed is screwing up so many things, there is no way to know what is actually happening in the economy if you read and listen to MSM ‘news’.
But, with the jobless numbers still climbing and the food stamp numbers still climbing and the paychecks still shrinking, of course the market for oil in the Us is shrinking. Wait until the market correction happens, and it will, and see the bottom drop out of ALL consumption.
DC on Thu, 18th Apr 2013 2:30 pm
Gee that one chart sure impressive right? Except its just N.D. An unimportant artificial administrative set of lines on a US map. I like reason 3, yea, most US drivers ARE staying home, but not for any great love of there matchstick and PVC homes. They are either unemployed, or underemployed, or if thats the not the case, they probably finally realize that in amerika every place is exactly the same corporate mono-scape, and there are few places worth going to.
I would stay put as well.
rollin on Thu, 18th Apr 2013 3:54 pm
Both gasoline and oil prices are within the past years range, no outlier here.
GregT on Thu, 18th Apr 2013 7:54 pm
Hmmm,
The oil price chart looks identical to the charts for almost every other commodity. Coincendence? Or manipulation?
Now, back to our regularly scheduled programming………………….
Beery on Thu, 18th Apr 2013 10:48 pm
” they probably finally realize that in amerika every place is exactly the same corporate mono-scape, and there are few places worth going to. ”
I’m glad someone other than me is finally saying it.
Beery on Thu, 18th Apr 2013 10:52 pm
As for the Bakken, I think the pundits need to start gearing up to talk about the bumpy plateau and (dare I say it) Peak Oil, because blaming short supply on ‘weather conditions’ isn’t going to cut it much longer. Right now they can get away with it, but what about when it starts happening in summer?
Dmyers on Fri, 19th Apr 2013 12:31 am
The North Dakota production graphic looks like half a Hubbert’s Curve. You can see the beginnings of a bumpy plateau at the end. This isn’t a continuing upward trend, as implied.
The graph shows a very gentle rate of increase for nine years and then suddenly an almost hockey stick shaped increase, in a span of three years. That is not a a healthy looking course of growth for the longer term. It’s the result of an all out, and now maxed out, level of fracking, a blind and futile attempt to get more than there is.
The graph shows that ND is at peak. Go sell that to your investors.
Billc on Fri, 19th Apr 2013 3:12 am
I see a very worrisome future with a stock market in decline. This time as the market declines, oil prices will stay above $85.00 instead of plunging to below $40.00 per bbl.
No way out.
GregT on Fri, 19th Apr 2013 5:26 am
Hockey stick shaped graphs, everywhere, all around us.
Could it be a result of “The Exponential Function”?