Peak Oil is You

Donate Bitcoins ;-) or Paypal :-)
Page added on December 28, 2010
Renewable and fossil electricity generation costs compared

To reduce fossil fuel use in electricity generation, the implementation of renewable energy is supported via subsidies or market mechanisms in many countries. These are required because the costs of renewable electricity are substantially higher than fossil fuel based power generation. In this article, the difference in cost structure is made clear by looking at the 2009 industrial and household electricity price in comparison with short-term cost forecasts for 2015 for nuclear, fossil, and renewable electricity generation.
Special attention is paid to the difference in interest rates of borrowed capital for energy projects. This has a large influence on nuclear and renewable energy costs as these require larger upfront capital investments. For example, nuclear electricity becomes cheaper than natural gas generation at low discount rates, but more expensive at high discount rates. In case of renewables at higher discount rates only onshore wind costs fall below household electricity prices in most countries, while in case of lower discount rates this is also the case for offshore wind and solar thermal electricity.
Introduction
The future electricity supply of countries is highly dependent upon making choices under uncertainty. The lifetime of a power plant is at least 20 years and can range up to 60 years, so the selection of power plant types has a long lasting effect. The costs of fossil fuel or nuclear power plant inputs is difficult to forecast as events in recent years show, and similarly is it difficult to forecast the decline in costs of renewable energy.
One of the choices that politicians have to make in the present is how to support renewable energy sources. Many OECD countries have put in place feed-in tariffs, which provide a fixed tariff on top of electricity prices to pay for renewable electricity. The idea is to stimulate renewable electricity to the extent that prices drop sufficiently over a long time period, so that it will be able to compete with fossil fuel power sources. Opposition to this system comes from those who think that costs will not drop sufficiently, at least not in the foreseeable future, leading to a lasting cost burden for society to create access to sufficient electricity supply.
To make an informed decision we, therefore, need to know a lot about different aspects of electricity generation. Including the technical potential of different electricity sources, how base-load and intermittent electricity sources can be combined, the requirements and costs of the electricity grid, and how the costs of electricity generation will develop over time depending upon technological change and input costs.
In this article a part of the data is provided for such an analysis by outlining the anticipated costs of electricity generation in OECD countries in 2015, and comparing this with 2009 price levels. This gives a perspective on how big the gap is between the costs of fossil/nuclear and renewable electricity generation in the near- to midterm future, as well as an idea about what society can afford to pay. The costs of electricity storage are not incorporated here, as these are not that relevant at the renewable electricity shares we are talking about in the near term future.
The costs of electricity generation at different discount rates
The generation costs of electricity sources for OECD countries are documented in detail by the International Energy Agency (IEA). Every few years they publish a report on the Projected Costs of Generating Electricity. The report documents the costs of electricity generation five years ahead by looking into expected costs of power plants built, as well as some are planned for construction in the near-term future in the OECD. For the 2010 report data of 187 power plants have been taken, including 72 renewable electricity power plants, 20 nuclear light water reactors, 27 natural gas fired power plants, 48 coal power plants, and 20 CHP power plants of which most are natural gas fired.
The calculations take total costs of the power plant during its lifetime including decomissioning in case of nuclear energy. These are divided by electricity generated during the same lifetime to get costs per kWh generated. The main financial factor of influence is the interest that needs to be paid on the capital borrowed for the power plant investment, also called the discount rate. The IEA includes two interest rates for their cost calculations, 5% and 10%, which provide a lower and upper bound. Jerome a Paris of the Oil Drum, who works in energy project investment for the wind sector, informed me that for private sector investments in energy projects 7-8% is a reasonable interest rate in today’s market. Utilities on the other hand are closer to a 5% rate for long term investments as they are able to borrow very cheaply. A second factor of major importance are assumed fossil fuel prices. As I do not have access to the full report I unfortunately do not know what the IEA assumed in this respect.
The data from the IEA report is given in table 1. There median costs and the cost range in dollar cents per kWh for seven different electricity sources is tabulated. The costs in general vary widely per source, for example at a 5% interest rate the levelised costs for Nuclear electricity generation were found to range between 2.9 and 8.2 dollar cents per kWh (in respectively Korea and Hungary).
Table 1 – Median and cost ranges for seven different electricity sources at a 5% and 10% interest rate.
*The values in this table have been corrected to exclude the price of carbon which is published in the IEA report.The price of electricity
Electricity prices for household and industry in the OECD are documented in detail in the Energy Prices & Taxes report of the International Energy Agency. The differences between industry and households price levels of this data set were described in detail in a previous post. The importance of making this distinction in choosing for the type of electricity supply is that there is a large difference in cost patterns. In nearly all countries industrial users of electricity use the most electricity and have to pay the lowest electricity price, as the tax burden mainly goes to household electricity users. The most extreme example is Denmark where electricity prices including taxes for Industry users are 12 US dollar cents per kWh, while household electricity prices are 36.5 US dollar cents per kWh. In discussing about the affordability of electricity sources for society it makes sense to look at both industrial and household electricity prices, and compare these with electricity generation costs. Often comparisons are only made on the household level which paints a distorted picture.
The electricity price and costs of nuclear and fossil electricity compared
Figures 1 to 4 give an overview of median OECD electricity generation costs for coal, natural gas, and nuclear electricity at 5% and 10% discount rates. The numbers used are from the IEA can be found in table 1. These are compared with the price of electricity in 2009 for 27 selected countries at a household and a industry price level. Households and small companies usually pay higher prices due a different tax structure. Sometimes, such as in my home country the Netherlands, there are also price agreements between public utilities and large industrial energy users to keep them more competitive. The industry price level, therefore serves as the lower bound, and the household price level as the upper bound of the electricity price.
Figure 1 – Industry Electricity Prices (2009) & IEA expected 2015 Non-Renewable Electricity Costs for 2015 at a 5% interest rate (large size). 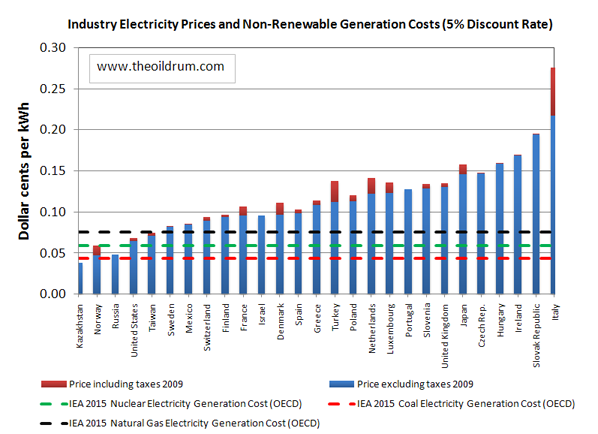
Figure 2 – Industry Electricity Prices (2009) & IEA expected 2015 Non-Renewable Electricity Costs for 2015 at a 10% interest rate (large size). 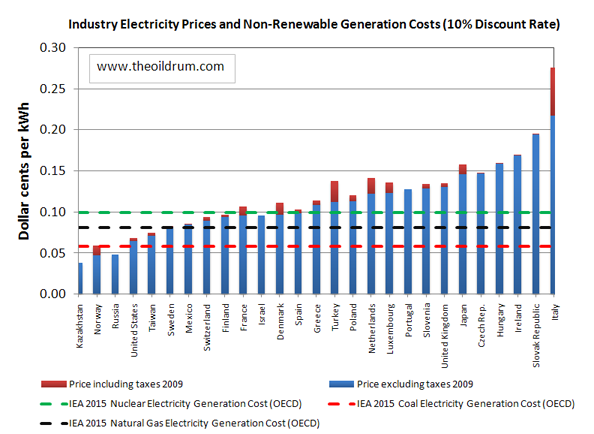
Figure 3 – Household Electricity Prices (2009) & IEA expected 2015 Non-Renewable Electricity Costs for 2015 at a 5% interest rate (large size). 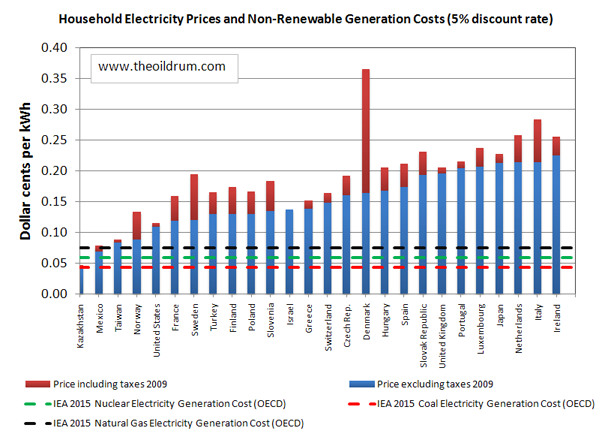
Figure 4 – Household Electricity Prices (2009) & IEA expected 2015 Non-Renewable Electricity Costs for 2015 at a 10% interest rate (large size). 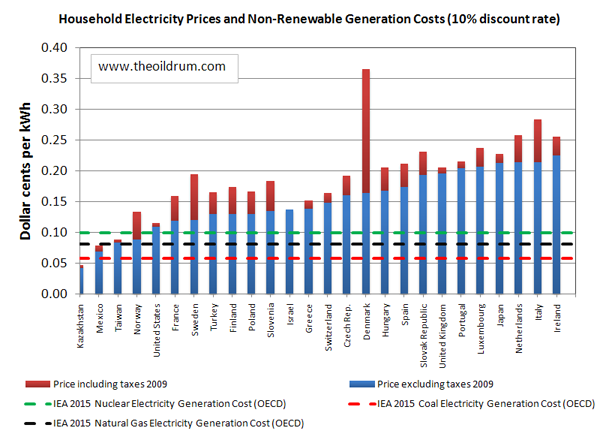
The electricity price and costs of renewable electricity compared
Figures 5 to 8 give an overview of median OECD electricity generation costs for onshore wind, offshore wind, photovoltaic solar, and solar thermal electricity at 5% and 10% discount rates. The numbers used are from the IEA and can be found in table 1. These are compared with the price of electricity in 2009 for 27 selected countries at a household and a industry price level.
Figure 5 – Industry Electricity Prices (2009) & IEA expected 2015 Renewable Electricity Costs for 2015 at a 5% interest rate (large size). 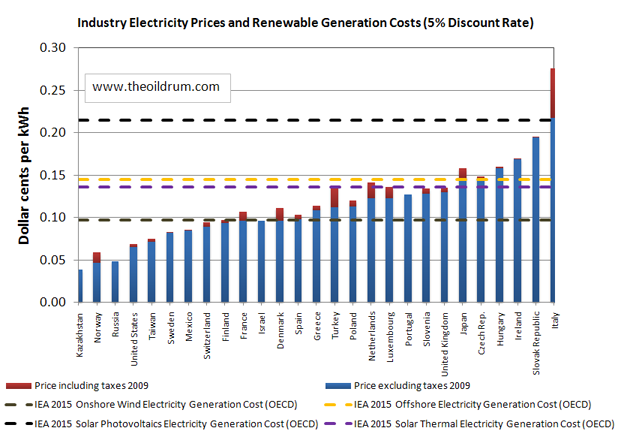
Figure 6 – Industry Electricity Prices (2009) & IEA expected 2015 Renewable Electricity Costs for 2015 at a 10% interest rate (large size)./i> 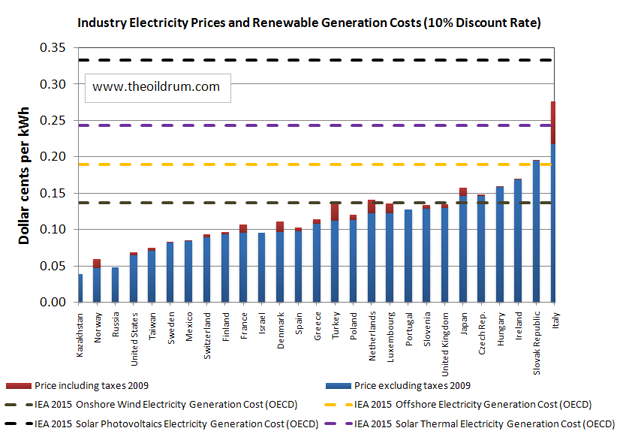
Figure 7 – Household Electricity Prices (2009) & IEA expected 2015 Renewable Electricity Costs for 2015 at a 5% interest rate (large size). 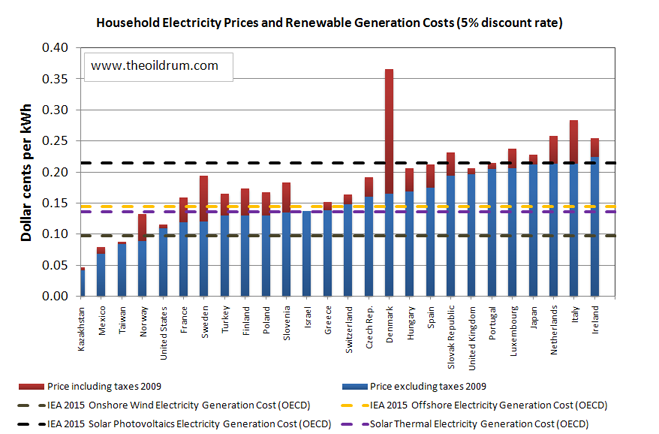
Figure 8 – Household Electricity Prices (2009) & IEA expected 2015 Renewable Electricity Costs for 2015 at a 10% interest rate (large size). 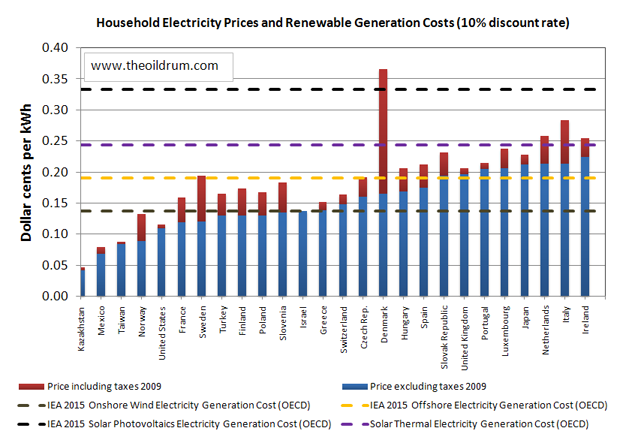
ObservationsThese observations pertain to a comparison between 2009 electricity prices, and the IEA 2015 expected median costs of electricity generation. These should be seen as best available indicators, not as absolute realities for the short-term future. They do not incorporate fully all factors such as storage costs, intermittency requirements, and flexibility of electricity generation. For a fully meaningful comparison incorporating such issues is required which will be the goal of future posts in this series.
– The costs of nuclear, coal, and natural gas are expected to remain cheaper than all renewable energy sources in the short-term future.
– The cost of nuclear electricity generation is strongly influenced by the chosen discount rate. At the 5% interest rate, nuclear energy is less expensive than natural gas while at a 10% interest rate it is more expensive.
– At a 5% interest rate, the costs of onshore wind electricity are significantly below electricity prices exluding taxes for households as well as industry in most countries, but this changes for a 10% interest rates where costs rise above industry electricity prices in 22 out of 27 countries.
– The costs of offshore wind electricity and solar thermal electricity at a 5% interest rate are below electricity prices excluding taxes for households in 14 out of 27 countries, but above prices for industry. At a 10% interest rate the costs rise above the electricity price for both household and industry in the majority to all of 27 countries.
– The costs of photovoltaic solar will remain above electricity prices in the short-term future regarding what interest rate used or whether household or industry electricity prices are taken as a reference.
– The costs of renewable energy are in general highly affected by a higher interes rate on borrowed capital, but this is even more so for solar energy technologies.
End notes
The author is aware that this is only a partial analysis and that it would have been better to:
– Compare electricity costs of different technologies for respective countries, but the author does not have the data to make such a comparison.
– To also include merit order effects for wind-electricity on the power market in this overview. Detailed information can be found in this report.
– Include data on the costs of electricity storage and how this affects the price of electricity.
If someone wants to provide specific information on these in the comments that would be helpful.
3 Comments on "Renewable and fossil electricity generation costs compared"
Mike1999 on Tue, 28th Dec 2010 8:34 am
Interesting, in what it leaves out.
Carbon: Russia’s Wheat Heat Wave Disaster: cost $15,000,000,000. Global Drought, what’s the price of fresh water?
Global Warming has Current Negative Externalities, that are not included in this analysis.
A new one: Birds subjected to Mercury, Make them Gay. So, I’d say Coal has a bit of a down side, with every lake and stream in America polluted with Mercury.
DC on Tue, 28th Dec 2010 2:16 pm
Yet another “study” that purports to show how renewebale energy is just too darn expensive, and thus cannot “compete” unless subsidized. Of course, I dont see any mention anywhere in this report that gives adjusted costs taking into account the massive subsidies that fossil fuels have received for the last century. And of course, zero mention that nuclear wouldnt even EXIST at all if not for immense subsidies and the off-loading of its costs onto rate-payers, ie everyone. I want to see table one with every single tax-credit, direct payout, “research credit” and handout given over to coal-oil-and nuclear removed, only then can we have an honest discussion about just whoes power generation is “too expensive”. Until that happens, reports like this are barely worth the electrons they are…uhhh emitting.
Kenz300 on Wed, 29th Dec 2010 3:36 am
Bring on the bicycles, mass transit, electric, flex fuel, and hybrid vehicles. In a world of limited resources we will need contributions from wind, solar, geothermal and second generation biofuels to keep our economy moving.
Next year the world population will surpass 7 billion people just 12 years after world population passed the 6 billion mark. Limited resources are coming head to head with ever increasing population growth.
How much oil will another billion people need?
How will limited resources of food, water, oil, tuna and rare earth metals be affected by the addition of another billion people?