Peak Oil is You

Donate Bitcoins ;-) or Paypal :-)
Page added on August 12, 2011
One year of Solar Power

Mid 2009. Depression. Ground flat interest rates. Oppressing unemployment. What better time than now to invest on tangible assets? That was the mindset that lead me to consider investing in Solar Photo-Voltaics (PV). I started studying the subject in order to become a micro-producer, taking advantage of newly passed legislation. Coincidence or not, a family member had recently returned from a working commission in Angola to set up a company that sells and installs solar micro-generation systems. I embarked on a interesting adventure that has had relevant developments.
Parts of this post were written in 2009 when I first attempted to apply for a special feed-in tariff. This experience has been logged at the European Tribune (part I, part II) where the original text contains several mistakes that have been corrected.
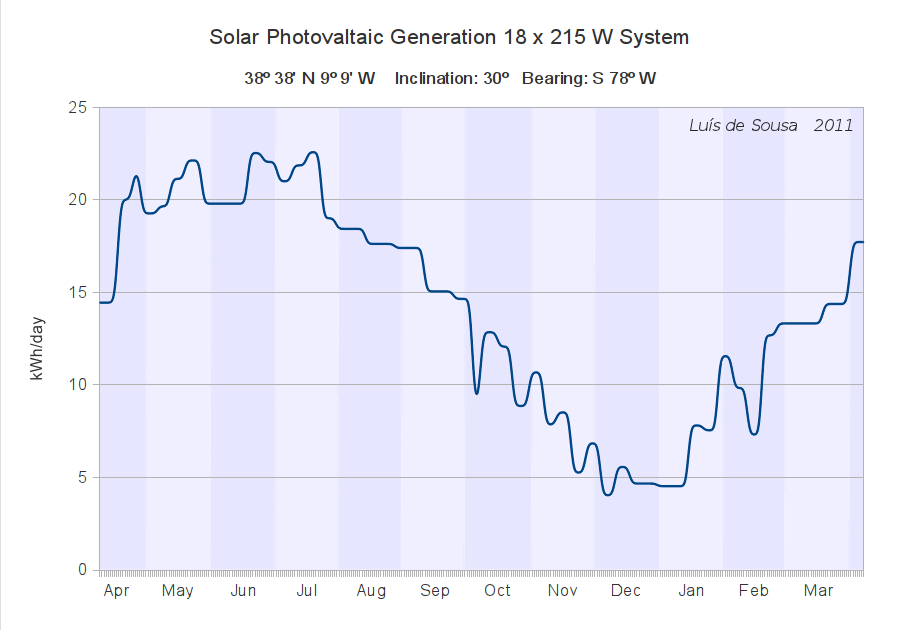 |
| Weekly data for the first year of production. Click for full version. |
The Prospects
Portugal is a lovely place, at the westernmost tip of Europe, with a long Atlantic coast, rich orography and clement weather. There is more sunshine only in the desert. Still, this state imports 85% of all the energy it consumes, with 100% for fossil fuels. A 10% of GDP foreign deficit is due in most part to the energy bill.
After successive failures (due to different reasons) to base the state’s electric generation on Nuclear, then Coal and more recently on Natural Gas, governments started shifting focus to internal renewable energies by the late 1990s. Several programmes have been taken up, providing feed-in tariffs to projects licensed to large investors (mostly Wind and small-Hidro, with a few stakes on large scale Photo-Voltaics).
In 2008 the national electric grid was opened to small investors, that up to that point had to rely solely on their means to balance or store the energy they produced. Now legislation exists that sets a few rules for micro-generators to connect to the grid, including:
- to connect a photo-voltaic system to the grid a thermal water heating system must also be in place;
- each micro-production system can only feed to the grid up to 3.68 kW at any given time;
- grid connection permits are issued in packages of 1000 units, totalling 3.68 MW of new installed capacity; the issuing time frame is open ad hoc and closes as soon as the 1000 licenses are attributed;
- the feed-in tariff attributed to the first lot of 1000 permits is 0.65 €/kWh, decreasing with each new lot, down to a minimum of 0.31 €/kWh;
- this feed-in tariff is valid during the first 6 years of operation, comes down to 0.30 €/kWh from the seventh to the twelfth year and from then at standard grid prices;
The photo-voltaic panels we considered to install are made in Portugal by a local manufacturer. When we started working on this project in 2009, this factory seemed to be setting the state of the art for industrial photo-voltaic cells, by then furnishing high end panel makers in Germany and Japan.
The system was projected to be set at my mother’s place, the house has two stories and the roof is shared with a single neighbour. Beyond that, this house is already paid for, no financial liabilities resting on it. The roof is divided in two sides, one facing Sunrise and another Sunset, which is not be the best of settings. But being the highest in a radius of several hundred meters and at this latitude, it gets plenty of sunlight. The Sunset side receives full radiation from 11 o’clock onwards in the Summer, this being the side where we planned to set the panels. The electricity consumption at this household varies from 110 kWh in the Summer to 150 kWh in the Winter. At the time we were expecting the system to generate from six times those figures during Summer to two times in Winter.
A Rigged Process?
With the project consolidated on paper we went on for the licensing process. It comprises the following steps:
- pre-registering on-line the household and the technical data;
- applying on-line for the license during the licensing period;
- installing the infra-structure in the 120 days following the licensing period;
- submitting the system to a technical inspection by a certified third party;
The on-line licensing took place at a website with the ironic name RenovaveisNaHora.pt (Portuguese for “renewables on the hour”). Sometime in October of 2009 a new licensing period was announced to start on the 2nd of November at 10 a.m.. The pre-registration was made and all left to do was waiting. The vendor warned me that there were 5000 pre-registrations and that we could experience difficulties applying, but at the time I wasn’t expecting major problems.
On the morning of the 2nd of November I tried to log on to the website around half past nine. Nothing. The other end was dead. I tried pinging the server, trace the connection, but silence was all I got; the website was simply down. After one hour continuously trying I quit.
I attempted to connect several other times during the day, also without success. On the morning of the 3rd of November I finally managed to log on. To my complete startelement the following announcement had been posted:
The licensing period opened on the 2nd of November at 10:00 am closed at 11:04 am, after the maximum number licenses had been attributed.
Something looked terribly wrong in this picture. The information I had pointed to the server being down during that time, or at least in a state of denial of service. So how could have 1000 candidates successfully applied for a license? A few days later, after some inquiries we were unofficially informed that at least half of the licenses were attributed to two of the largest banks in the country and hundreds others ended up in the hands of large institutional investors. There were horror stories floating around of entire call-centers mobilised to generate traffic to block the server from the common man. This was all very disheartening and I started to think I wouldn’t become a Solar producer.
A new internet auction-like round of applications took place during the first days of December, still that year. Like before, at 9 a.m. it was impossible to access the registration server, clogged with the huge amounts of applicants trying to access. But this time something went different, the server was so overwhelmed that it went down. Those responsible were only able to bring it back online close to mid-day, when everyone thought it already hopeless to keep trying to apply. Every one except my vendor, who was able to register my system plus a few others of his clients.
Setup
Roof mounting started less than two months later; by March we were able to call in the certification process and finally on the 9th of April of 2010 I became an happy electricity producer, right in time for the best period of the year. The system is composed by the following elements:
- 18 x 215 W solar panel
- 1 x electric current inverter, limiting at 3850 W
- 1 x 2 m2 water heating panel
- 1 x 200 litres water tank
- 1 x electric boiler
The panels are mounted on the rooftop with an inclination of 30º and oriented to sunset (bearing: South 78º West). Not the best of settings (optimal would be to the South) but re-orienting the rooftop wasn’t an option. The critical thing about this sub-optimal orientation is the push back of break-even beyond the period of maximum feed-in tariff, the first six years. The data provided by the vendor at the time was leaving me comfortable, even though it was considerably higher than that provided by the JRC Solar Calculator (a map of horizontal irradiation in Europe can be found here).
The installation included structural reinforcement to the roof; the cabling linking to the electric grid and new power meters, one for consumption, another for production; linkage of the water tank to the house water circuit and an electric water boiler that overrides the traditional natural gas boiler. Sunlight is able to heat water for all home needs from mid-March to mid-November; in the remainder of the year the electric boiler is timed to heat the water in the tank for about one hour, right before wake up time.
One year of electricity
From April of 2010 to April of 2011 I thoroughly monitored the system output, collecting weekly data whenever possible. As the Winter came to an end it became obvious the energy generated during the first year of operation would exceed 5 MWh. Here’s that data:
| |
| Weekly data for the first year of production. Click for full version. |
The first interesting thing is to compare this data to the projections by the JRC Solar Calculator:
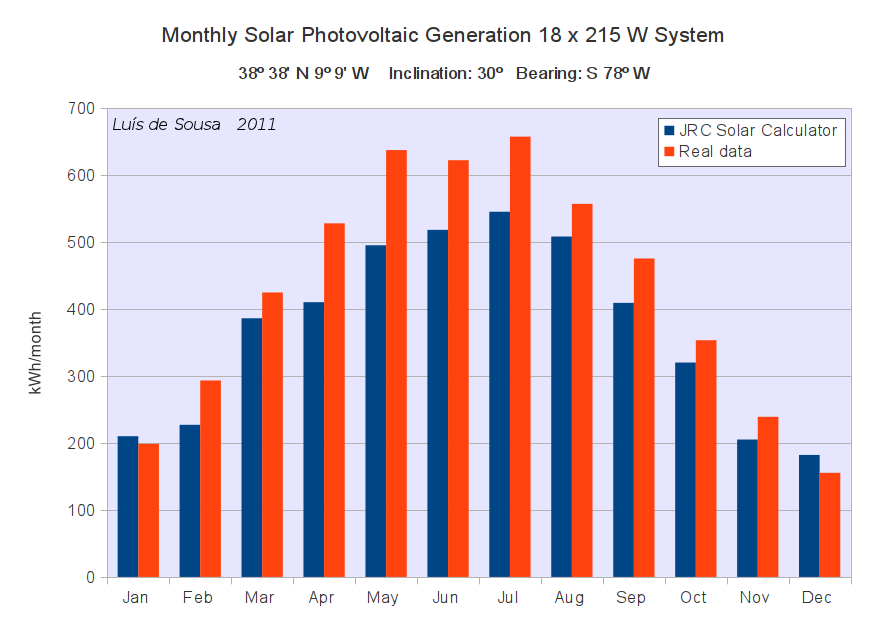 |
| Monthly data compared to the JRC Solar Calculator projection. Click for full version. |
There are two things that immediately stand out from this graph: the wider variation of the real data and the better performance of the system in place. The latter may be due to the Calculator not including recent advancements in PV efficiency, but also to a less than perfect usage of this handy tool; I fully endorse it to assess site adequacy. The actual data for yearly production is 5140 MWh, in contrast to the 4420 MWh projected by the Calculator, a difference of more than 16%.
The wide seasonal variation, about 5 times from Winter Solstice to Summer Solstice, is very relevant for the planning of a national Energy Mix. Even in a place like Portugal Solar energy can’t provide the majority of the electricity needs, especially in Winter, when light hours are at the minimum and cloudiness peaks. The good thing is that other renewable energies promoted in the country are highly complementary to Solar: Wind peaks during the stormy seasons around the Equinoxes, and rainfall peaks around the Winter Solstice, providing Hydro-power with its fuel.
Marginal price
Another important piece of information that can be calculated from this data is the marginal electricity price required by this system; it will take several steps. First of all is the computation of the total of energy produced by the system during its lifetime. The solar panel maker provides a warranty of 40 years during which time a linear decline of efficiency down to 78% of the original nameplate capacity should take place (materials worn out with time). An expression can be produced to calculate expected production as a percentage of the original at the nth year of operation:
E(n) = -0.54n + 100
Production at the nth year of operation can be calculated simply using the figure for the first year of production:
P(n) = P(1) x E(n)
The total energy produced by the system during its 40 year lifetime is the integral of this production curve, which can also be calculated as a simple sum. In the case of this system it is just over 180 MWh. The upfront cost, excluding the water heating components, was in the order of 18 000 €. The marginal price is hence 0.01 €/kWh, well above traditional energy sources. This value doesn’t count maintenance or debt servicing costs, which shall be dealt with later.
Optimal System
But in the meantime prices have fallen down and panel efficiency has continued to rise. Right now a system like mine, but with 245 W panels, can be bought for 13 500 €. Considering that my system isn’t optimally oriented, the actual marginal price is in reality quite lower. To have an idea of what this may be, the Solar Calculator can produce optimal orientations and inclinations that help identifying an optimal site. In Portugal this would be at the Algarve, where by sheer coincidence a lot of folk from the northern states are presently spending their vacations. At 37º 14′ North, 7º 56′ West the Solar Calculator recommends an inclination of 32º for a bearing at South 3º East, which for a 4.4 kW system should produce 6.25 MWh in a year. But since my own experience showed that the Solar Calculator, as is, is underestimating production by some 16%, the actual value may be closer to 7.27 MWh in a year. With these figures new values for the marginal price can be computed:
| Site | Upfront Cost (€) | First year of production (kWh) | Total Energy Produced (MWh) | Marginal Electricity Price (€/kWh) |
| Setúbal Peninsula | 18700 | 5140 | 183 | 0.102 |
| Algarve (JRC) | 13500 | 6250 | 223 | 0.061 |
| Algarve (adjusted) | 13500 | 7268 | 259 | 0.052 |
These figures are compelling and not only show huge improvements in Solar power efficiency, they also point to an important approximation to other energy sources. The 5 cents per kWh is actually lower than what can be calculated from the data on Jérôme’s latest offshore Wind project. So far these feed-in tariff programs for Solar micro-generation have been a success, creating an industry and most importantly reducing renewable electricity costs.
Other costs
The issue with the previous figures is that they do not take into account costs such as maintenance or debt servicing. In the 15 months my system has been in operation there has been a single maintenance issue, but with an escape valve on the water tank. It is hard to foresee what sort of maintenance issues may come up with the PV system, but of note is the warranty of the inverter being shorter than for the panels. Hence adding a parcel for a substitution of this equipment seems a sensible choice. Insurance costs are not included for this sort of micro-generation systems are usually covered by standard home insurance policies; though for industrial applications this is an issue.
Debt is the real problem because interests have soared since last year. Even renewable energy dedicated lines of credit are imposing interest over 6%/a. A 60 month loan for the upfront costs discussed above easily add over 4 500 € to the total project cost. The following table summarizes these new costs with debt on 100% of the up front investment, thus providing a top to marginal electricity prices:
| Site | Upfront Cost (€) | Maintenance (€) | Debt Servicing (€) | Total Energy Production (Mwh) | Marginal Electricity Price (€/kWh) |
| Setúbal Peninsula | 18700 | 2000 | 5650 | 183 | 0.144 |
| Algarve (JRC) | 13500 | 2000 | 4700 | 223 | 0.091 |
| Algarve (adjusted) | 13500 | 2000 | 4700 | 259 | 0.078 |
Suddenly things got a bit bleak. Banks are charging spreads of some 5% over the Euribor interbank lending rate and with it killing many investments. Naturally this is about micro-generation systems that amount to relatively low investments, assuming financing is required for 100% of the upfront cost is a worst case scenario. Wrapping up these calculations it can be said that the marginal electricity price for a solar PV system optimally sited at the Algarve ranges somewhere between 5 and 8 cents per kWh. While not spectacular, these figures point to Solar PV entering a maturity stage now comparable to Wind power. In Portugal the consumer is presently paying close to 13 cents per kWh, with that figure projected to go over 15 cents per kWh by 2013.
Feed-in tariffs
Of all the numbers referenced before one that may be have passed discretely so far is actually the most problematic: the 40 year system lifetime. It is like investing in oak wood, with the difference that electricity generated from solar panels is indistinguishable from that generated by other sources (actually natural gas and hydro can differentiate their product, but that’s an issue for another time). Investors may choose oak wood because it is a finer product than pine, for instance, but with electricity this doesn’t happen. Electricity can be seen as a perfect concurrency market where profit only exists in the presence of scarcity; on a abstractly normal market the investor would get financial break-even only at the very end of project lifetime. In other words, solar PV is a very unattractive investment from the perspective of the individual investor.
The main consequence of this is the indispensableness of feed-in tariffs. They are not a tool to increase the competitiveness of supposedly expensive renewable energies, their main function is to anticipate financial returns in time, and with it break-even. There will be no private investment on Solar energy without feed-in tariffs.
In closing, an important question can be answered with the data collected here: what feed-in tariff would be needed to anticipate financial break-even to the nth year of operation? This can be computed using the efficiency decline function, and the quotient between total energy produced at the nth year of production and cost:
B(n) = Sum1n[P(n) x E(n)] / C
Where C is the cost. For the several scenarios analysed above the resulting curves look like this:
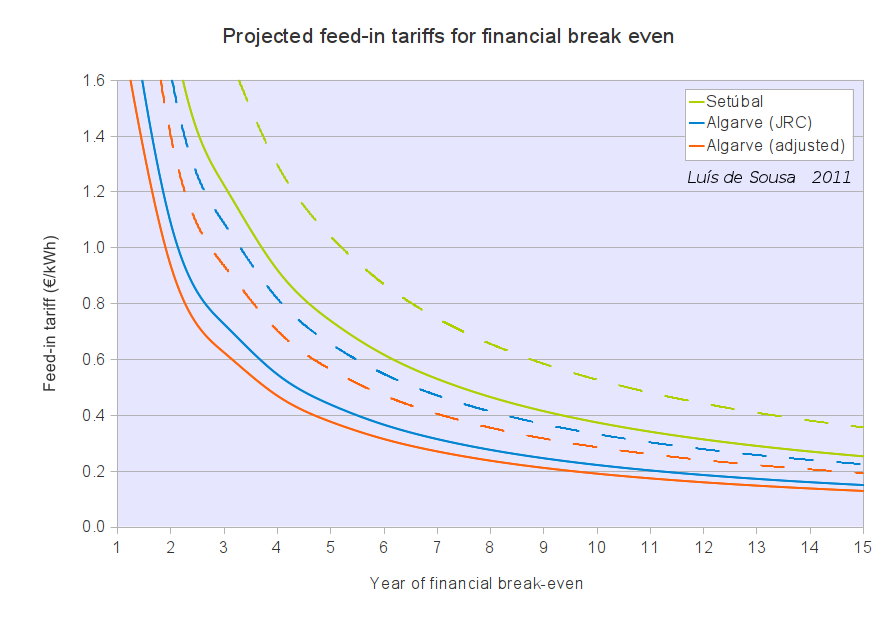 |
| Feed-in tariff as a function of break-even time. Click for full version. |
Financial break-even before the 6th year of operation requires huge feed-in tariffs, but even at 10 years of operation all systems require 20 cents per kWh or more. As a comparison, Wind energy is today an healthy business, usually reaching break-even at the 10th year of operation with a feed-in tariff around 7.5 cents per kWh. This is the sheer weight of such a long lifetime, and possibly the biggest challenge to the success of Solar power.
Conclusions
So far I’m pretty happy to have become a solar electricity micro-producer. Financial break-even is still some 6 years away, which is not fantastic but perfectly manageable; even with a less than optimal setting, the system should after that generate a small but regular profit for decades to come. I also had the opportunity to participate in a very interesting moment for the Solar industry, where the efforts of several governments producing generous feed-in tariffs for micro-producers resulted in visible cost reductions and efficiency increases with economies of scale.
Optimally set systems (regarding inclination and bearing) at sunny places like southern Portugal, Spain or northern Africa are operational with marginal electricity prices between 5 and 8 cents per kWh, mostly depending on debt servicing costs. While not cheap, these figures are not expensive either and point to an important level of maturity of Solar PV technology.
But for Solar PV to make any relevant penetration on the Energy Mix, high feed-in tariffs will continue to be required, a product of the long lifetime of this technology. Governments face a huge challenge to continue the promotion of Solar PV with this scheme, reliant on private investors and private lenders. Especially at a time where austerity and budget cuts are the main policy, it will be very hard to keep pushing feed-in tariffs that are multiples of present electricity prices.
3 Comments on "One year of Solar Power"
sunweb on Fri, 12th Aug 2011 3:16 pm
I have a 3kWh Grid-tie system and have been involved with alternative energies (wind and various solar applications) for 40 years. Having said that, they are at best transition technologies. I once thought and was invested heart, energy and financially in alternatives. Now I see a bigger picture and consider these attempts as simply “business as usual” new verse.
Solar and Wind are not renewable. The energy from solar and from wind is of course renewable but the devices used to capture the energy of the sun and wind is not renewable. Nor are they green or sustainable.
An oak tree is renewable. A horse is renewable. They reproduce themselves. The human-made equipment used to capture solar energy or wind energy is not renewable. There is considerable fossil fuel energy embedded in this equipment. The many components used in devices to capture solar energy, wind energy, tidal energy and biomass energy – aluminum, glass, copper, rare metals, petroleum in many forms to name a few – are fossil fuel dependent.
Wind used by sailing ships and old style “dutch” wind machines is renewable and sustainable.
From: Energy in the Real World with pictures of proof.
http://sunweber.blogspot.com/2011/01/energy-in-real-world.html
DC on Fri, 12th Aug 2011 6:13 pm
This fellows comments in the Rigged Process stand out to me. Why would banks and large financial firms attempt to block people from getting there licences. Well, for starters big banks love big energy, specically, large fossil-fuel energy. The last thing any of those types want is people generateing there own power. I live in a country that actively discourages wind or on-site generation, except in press-releases, then they are all for it. The reality is, they prefer to build a huge 10b+ dam and ruin one of the last remaining river valleys in the province. At least in Portugal, they actually got as far as a FIT. I would also like to point out, that despite large amounts on ‘new;(if useless construction) going on locally, not ONE of these homes or businesses are installing any form of solar. Its BAU, all consruction is the same today as it was decades ago, all connection to distant, centrally generated power stations with zero effort made to incoporate either active or passive solar technology into new construction.
If this is not being done in 2011, how do we ever expect to transition to anything other than more of the same?
BS on Fri, 12th Aug 2011 8:09 pm
Interesting post.
While researching a small solar installation, I found the system cost was about 1/2 for the panels and the other 1/2 for installation, inverters, etc. It was not grid tied, so battery cost was substantial. This probably means we will not see major declines in total system costs like the 30% you cite.
There seem to be several ways to handle the debt service problem. Bureaucracy hurdles will hopefully decline after the grip on government by utilities declines. So my take away from the post is solar is close and getting closer all the time. Fossil fuel generated electricity is going to get more expensive and perhaps a lot more expensive.