Peak Oil is You

Donate Bitcoins ;-) or Paypal :-)
Page added on March 2, 2011
Global Biofuel Production

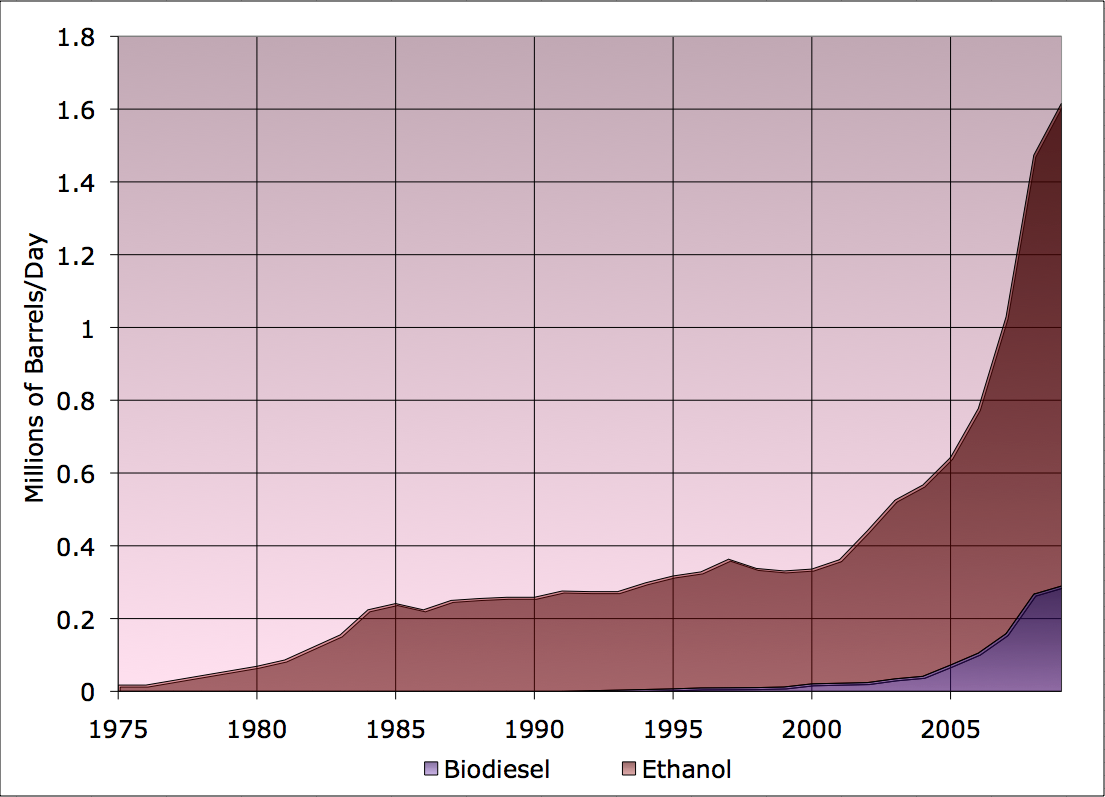
Here are updated graphs of global biofuel production through 2009. The latest statistics are from the Renewables 2010 Global Status Report. The graph above shows volume of biofuel production (expressed in millions of barrels/day), broken out by ethanol and biodiesel. The main takeaway is that biofuel growth slowed sharply in 2009 with the lower fuel prices of the great recession, but production did not actually fall.
The next graph shows the share of US ethanol in the global biofuel total.
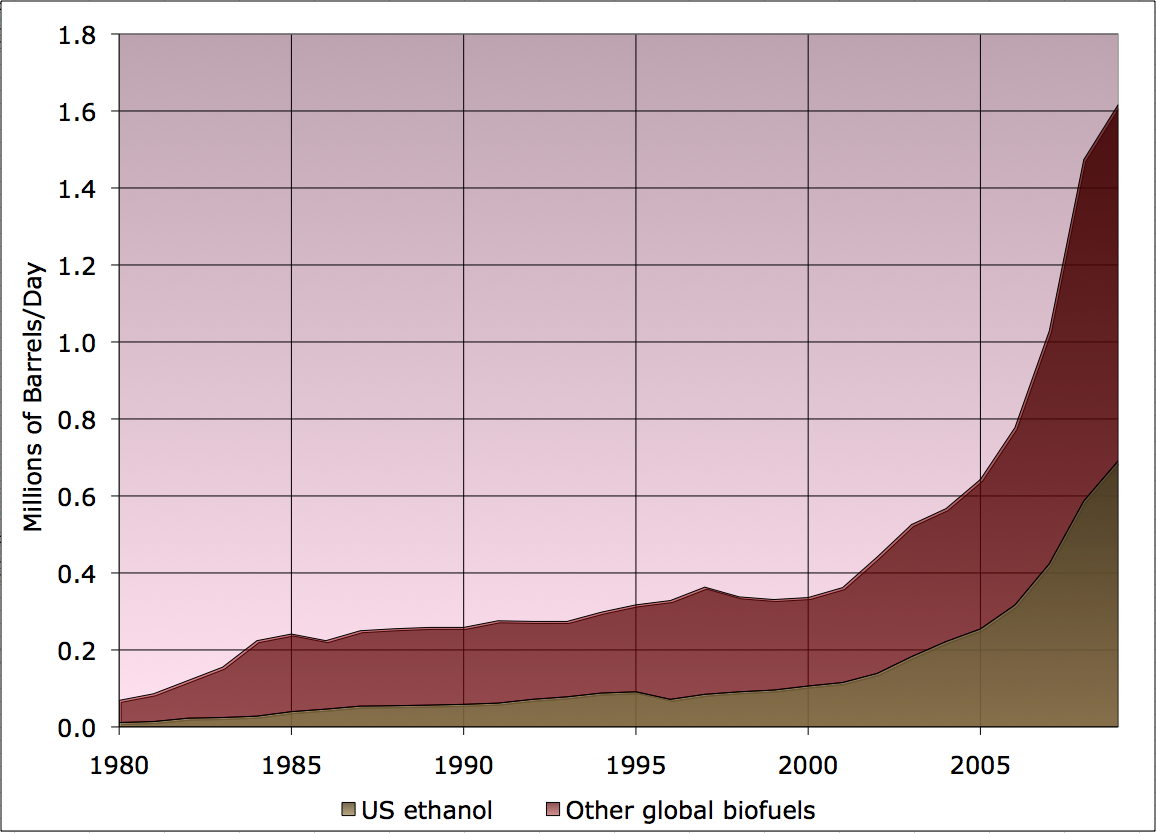
US corn ethanol production continues to be about half of the global total (the other major players are Brazilian sugar ethanol and European biodiesel production).
Expressed as a fraction of the global liquid fuel supply (from the EIA), it looks like this:

We are up to just shy of 2% of global fuel being biofuels in 2009 (probably we crossed that in 2010).
Leave a Reply