Hi - occasional reader first time caller...
I've been playing with the numbers in the BP statistical review and found that over the time period for which data is available (1965+) oil is getting lighter. I did this by taking annual oil production in tonnes and dividing it by the annual production in barrels. This shows a constant decrease in the average weight of a barrel of oil - why?
I could accept if it was just a one-off annual change - but it's a constant trend.
Any clues / suggestions?


PeakOil is You
Why is oil getting lighter?
Why is oil getting lighter?
![]() by v6g » Fri 24 Apr 2009, 13:02:27
by v6g » Fri 24 Apr 2009, 13:02:27
- v6g
- Wood

- Posts: 6
- Joined: Fri 24 Apr 2009, 12:57:22
Re: Why is oil getting lighter?
![]() by zoidberg » Fri 24 Apr 2009, 13:20:15
by zoidberg » Fri 24 Apr 2009, 13:20:15
Maybe they keep adding barrels of oil equivalent like natural gas liquids, biofuel so thats why the barrels number gets higher, while actual oil production isnt rising as fast.
-

zoidberg - Tar Sands

- Posts: 635
- Joined: Wed 23 Feb 2005, 04:00:00
- Location: Center of north america
Re: Why is oil getting lighter?
![]() by Bas » Fri 24 Apr 2009, 13:44:52
by Bas » Fri 24 Apr 2009, 13:44:52
Would you care to illustrate your findings?
- Bas
Re: Why is oil getting lighter?
![]() by Schmuto » Fri 24 Apr 2009, 13:50:57
by Schmuto » Fri 24 Apr 2009, 13:50:57
They're using thinner and thinner barrels.
- Schmuto
- Tar Sands
- Posts: 659
- Joined: Wed 17 Dec 2008, 04:00:00
Re: Why is oil getting lighter?
![]() by efarmer » Fri 24 Apr 2009, 14:26:16
by efarmer » Fri 24 Apr 2009, 14:26:16
Could it be that catalytic cracking and refining are more
efficient? They do end up with more than a barrel
of net liquids from a barrel of crude after refining
because things like gasoline are far more volume
and less density than what they are derived from.
Stay tuned, the deep talent pool of this forum
has petroleum scientists and geologists and they
will put us in the know with the numbers to back it up.
-

efarmer - Intermediate Crude

- Posts: 2003
- Joined: Fri 17 Mar 2006, 04:00:00
Re: Why is oil getting lighter?
![]() by v6g » Fri 24 Apr 2009, 17:03:47
by v6g » Fri 24 Apr 2009, 17:03:47
Ok - here goes (not too good with attaching pictures ... first try).
Graph (large)
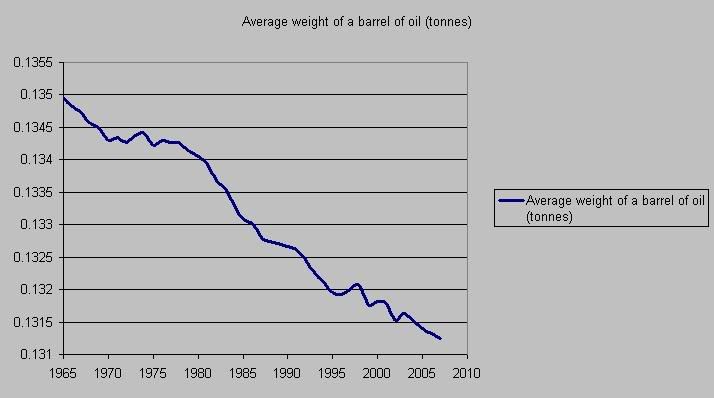
This shows the weight of a barrel of oil in tonnes according to the 2007 Statistical Review of world energy. (ie: in 1965 a barrel of oil weighed about 0.135 tonnes).
I made this chart by taking the world data from the statistical review worksheet for "Oil Production - tonnes" and dividing it by the data on "Oil Production - barrels". The barrels data is in thousand barrels daily - so I corrected it for leap years (interestingly otherwise it showed a noticable "bump" every 4 years).
It's a very small change - but there's a definite trend - it's that that arouses my curiosity. This shows world totals - it would be interesting to compare specific regions/countries.
Graph (large)
This shows the weight of a barrel of oil in tonnes according to the 2007 Statistical Review of world energy. (ie: in 1965 a barrel of oil weighed about 0.135 tonnes).
I made this chart by taking the world data from the statistical review worksheet for "Oil Production - tonnes" and dividing it by the data on "Oil Production - barrels". The barrels data is in thousand barrels daily - so I corrected it for leap years (interestingly otherwise it showed a noticable "bump" every 4 years).
It's a very small change - but there's a definite trend - it's that that arouses my curiosity. This shows world totals - it would be interesting to compare specific regions/countries.
Last edited by Ferretlover on Tue 11 Aug 2009, 08:41:50, edited 1 time in total.
Reason: Converted [img] to [url] per COC 3.1.2 Graphic content.
Reason: Converted [img] to [url] per COC 3.1.2 Graphic content.
- v6g
- Wood
- Posts: 6
- Joined: Fri 24 Apr 2009, 12:57:22
Re: Why is oil getting lighter?
![]() by v6g » Fri 24 Apr 2009, 17:08:51
by v6g » Fri 24 Apr 2009, 17:08:51
$this->bbcode_second_pass_quote('zoidberg', 'M')aybe they keep adding barrels of oil equivalent like natural gas liquids, biofuel so thats why the barrels number gets higher, while actual oil production isnt rising as fast.
I don't think so - BP's spreadsheet has separate worksheets for Natural Gas and I get the feeling that they don't consider things like biofuels in their data. But maybe you know more about it than me - I'm just a "casual" observer.
$this->bbcode_second_pass_quote('efarmer', 'C')ould it be that catalytic cracking and refining are more efficient? They do end up with more than a barrel of net liquids from a barrel of crude after refining because things like gasoline are far more volume and less density than what they are derived from.
Again, I don't think so, AIUI the data is for raw production, not refined end-product.
- v6g
- Wood
- Posts: 6
- Joined: Fri 24 Apr 2009, 12:57:22
Re: Why is oil getting lighter?
![]() by efarmer » Fri 24 Apr 2009, 17:59:03
by efarmer » Fri 24 Apr 2009, 17:59:03
Since a tonne of oil is 1000 kilograms mass and a barrel is 42 U.S. gallons
of volume the only guess I have is we have been averaging progessively
lighter crude supplies or measuring in warmer temperatures, or both.
I know they use BOE and TOE (barrel of oil equiv. and tonne of oil equiv.)
to adjust for varying energy content of crude by weight or volume.
I assume the money goes down for TOE and BOE and that the
weight versus volume trends and variances are adjusted out.
Either that or money is dumber than I believe it to be.
Over 4 kilos per barrel on an almost straight line trend does
seem strange.
Last edited by efarmer on Fri 24 Apr 2009, 18:40:40, edited 2 times in total.
-
efarmer - Intermediate Crude
- Posts: 2003
- Joined: Fri 17 Mar 2006, 04:00:00
Re: Why is oil getting lighter?
![]() by v6g » Fri 24 Apr 2009, 17:59:26
by v6g » Fri 24 Apr 2009, 17:59:26
Damnit - you've got me wondering now...!!
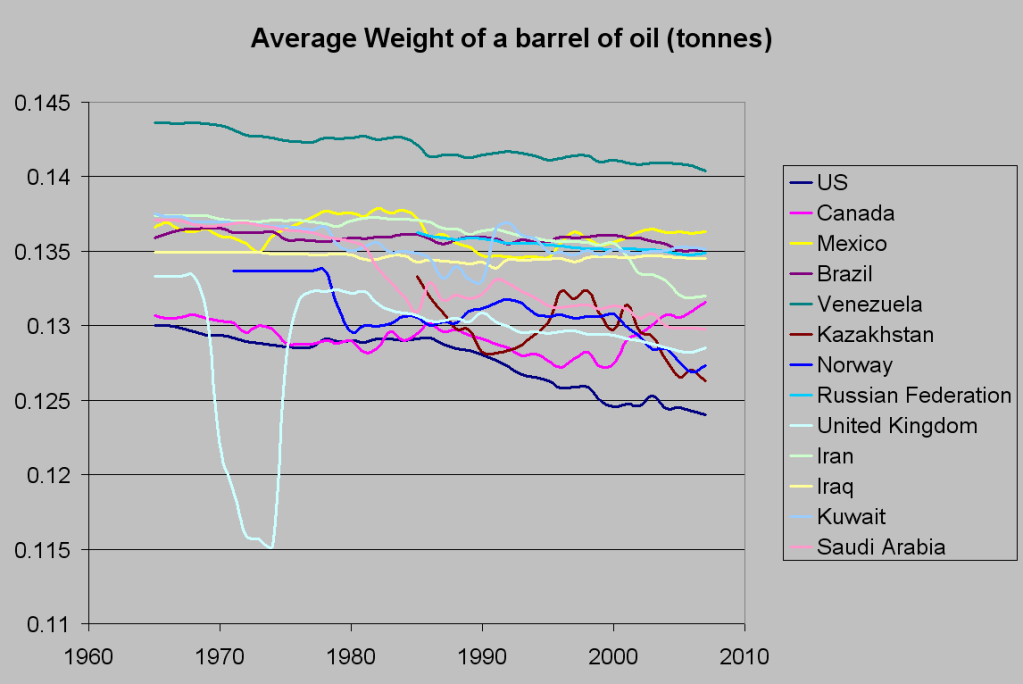
Here's the graph for a number of countries - they all show the same thing (I wonder what happened in the UK in the early 70's).
Chart (huge)
Remember, these are AVERAGES not production TOTALS.
Note how Canada starts increasing once the oil sands came online around the turn of the century.
Here's the graph for a number of countries - they all show the same thing (I wonder what happened in the UK in the early 70's).
Chart (huge)
Remember, these are AVERAGES not production TOTALS.
Note how Canada starts increasing once the oil sands came online around the turn of the century.
Last edited by Ferretlover on Tue 11 Aug 2009, 08:40:31, edited 1 time in total.
Reason: Converted [img] to [url] per COC 3.1.2 Graphic content.
Reason: Converted [img] to [url] per COC 3.1.2 Graphic content.
- v6g
- Wood
- Posts: 6
- Joined: Fri 24 Apr 2009, 12:57:22
Re: Why is oil getting lighter?
![]() by v6g » Fri 24 Apr 2009, 18:01:57
by v6g » Fri 24 Apr 2009, 18:01:57
$this->bbcode_second_pass_quote('efarmer', 'S')ince a tonne of oil is 1000 kilograms mass and a barrel is 42 U.S. gallons
of volume the only guess I have is we have been averaging progessively
lighter crude supplies or measuring in colder temperatures, or both.
I know they use BOE and TOE (barrel of oil equiv. and tonne of oil equiv.)
to adjust for varying energy content of crude by weight or volume.
I assume the money goes down for TOE and BOE and that the
weight versus volume trends and variances are adjusted out.
Either that or money is dumber than I believe it to be.
Or, in other words, this could be an inverse measure of global warming ... now there's an idea!!??
- v6g
- Wood
- Posts: 6
- Joined: Fri 24 Apr 2009, 12:57:22
Re: Why is oil getting lighter?
![]() by efarmer » Fri 24 Apr 2009, 18:30:23
by efarmer » Fri 24 Apr 2009, 18:30:23
I have seen weights per barrel vary from about 127 to almost 155 kilos depending on source so
it does seem that 130 to 135 range you are showing is on the lighter end and well within the
norms. I will be interested to learn why it is such a constant slope down for this period
once someone who knows chimes in.
Do you have global data instead of BP company specific?
it does seem that 130 to 135 range you are showing is on the lighter end and well within the
norms. I will be interested to learn why it is such a constant slope down for this period
once someone who knows chimes in.
Do you have global data instead of BP company specific?
-
efarmer - Intermediate Crude
- Posts: 2003
- Joined: Fri 17 Mar 2006, 04:00:00
Re: Why is oil getting lighter?
![]() by Pops » Sat 25 Apr 2009, 08:31:11
by Pops » Sat 25 Apr 2009, 08:31:11
Wow! A real live oil question, how novel.
I have no clue but notice on the country chart each plot starts at a certain level, drops some, then recovers before a continual decline.
I know nothing about the science but it is nice to see a thread about something other than politics.
I have no clue but notice on the country chart each plot starts at a certain level, drops some, then recovers before a continual decline.
I know nothing about the science but it is nice to see a thread about something other than politics.
The legitimate object of government, is to do for a community of people, whatever they need to have done, but can not do, at all, or can not, so well do, for themselves -- in their separate, and individual capacities.
-- Abraham Lincoln, Fragment on Government (July 1, 1854)
-- Abraham Lincoln, Fragment on Government (July 1, 1854)
-

Pops - Elite

- Posts: 19746
- Joined: Sat 03 Apr 2004, 04:00:00
- Location: QuikSac for a 6-Pac
Re: Why is oil getting lighter?
![]() by dinopello » Tue 05 May 2009, 22:05:26
by dinopello » Tue 05 May 2009, 22:05:26
I would look for some other fundamental trend that would point to a correlation. For example - most likely the specific gravity of oil (on average) is getting smaller. Do "heavy" crudes or "light" crudes have (in general) the lower specific gravity ? What about "sweet" and "sours" ? I know specific gravity and viscosity are generally not correlated.
-

dinopello - Light Sweet Crude

- Posts: 6088
- Joined: Fri 13 May 2005, 03:00:00
- Location: The Urban Village
Re: Why is oil getting lighter?
![]() by Pops » Tue 11 Aug 2009, 07:50:46
by Pops » Tue 11 Aug 2009, 07:50:46
Bump.
The legitimate object of government, is to do for a community of people, whatever they need to have done, but can not do, at all, or can not, so well do, for themselves -- in their separate, and individual capacities.
-- Abraham Lincoln, Fragment on Government (July 1, 1854)
-- Abraham Lincoln, Fragment on Government (July 1, 1854)
-
Pops - Elite
- Posts: 19746
- Joined: Sat 03 Apr 2004, 04:00:00
- Location: QuikSac for a 6-Pac
Re: Why is oil getting lighter?
![]() by Grautr » Tue 11 Aug 2009, 08:03:06
by Grautr » Tue 11 Aug 2009, 08:03:06
$this->bbcode_second_pass_quote('dinopello', 'I') would look for some other fundamental trend that would point to a correlation. For example - most likely the specific gravity of oil (on average) is getting smaller. Do "heavy" crudes or "light" crudes have (in general) the lower specific gravity ? What about "sweet" and "sours" ? I know specific gravity and viscosity are generally not correlated.
It must be something to do with the quality of the oil. Over time they are pumping out less quality stuff.
What happened in Britain in the 70s? Thats when North Sea oil came online big time.
-

Grautr - Lignite
- Posts: 271
- Joined: Thu 09 Feb 2006, 04:00:00
- Location: Maastricht, the Netherlands
