Sounds like something out of Die Walkure.
Ilargi posted this chart today at The Automatic Earth, with the advice
$this->bbcode_second_pass_quote('', 'M')y friend Francois sends this graph from the St. Louis Fed. I suggest you take a good long hard look:


PeakOil is You
BOGNONBR ?????????
First unread post • 19 posts
• Page 1 of 1
BOGNONBR ?????????
![]() by TheDude » Sat 11 Oct 2008, 22:49:47
by TheDude » Sat 11 Oct 2008, 22:49:47
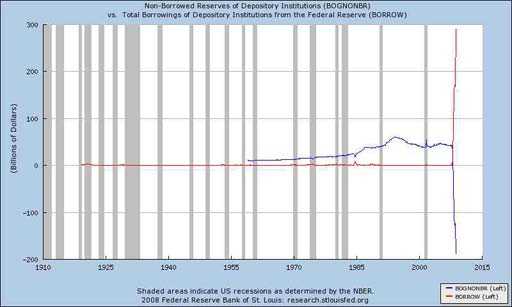
In case it's not evident, the red and blue lines fly off the chart for lack of scale. The original post links to a full size image.
Trying to find out what exactly "bognonbr" is ("Non-Borrowed Reserves of Depository Institutions") I get equally puzzled/alarmed postings at kitco, gotinflation.com, what have you.
Money Matters: Strange And Scary Federal Reserve Charts!

$this->bbcode_second_pass_quote('', 'T')he main thing here is, both the 9/11 spike and the present collapse are UNPRECEDENTED. They are very destabilizing and are indicators of something very twisted and out of ordinary. Any way we look at this, it is terrible. It is also obvious that this crisis is much worse than the one that brought into being both the Bretton Woods II and the Plaza Accords. I sometimes read officials musing about the possibility of solving this mess via such a meeting but it never happens since it means China gets to dictate some terms to us in exchange of changing the value of the yuan. Namely, we have to live within a strict budget.
Cogito, ergo non satis bibivi
And let me tell you something: I dig your work.
And let me tell you something: I dig your work.
-

TheDude - Expert

- Posts: 4896
- Joined: Thu 06 Apr 2006, 03:00:00
- Location: 3 miles NW of Champoeg, Republic of Cascadia
Re: BOGNONBR ?????????
![]() by Dreamtwister » Sat 11 Oct 2008, 23:52:59
by Dreamtwister » Sat 11 Oct 2008, 23:52:59
That first image is scary as hell. I mean, I've seen some scary shit posted here before, but that chart...I can't even describe it.
The whole of human history is a refutation by experiment of the concept of "moral world order". - Friedrich Nietzsche
-

Dreamtwister - Intermediate Crude

- Posts: 2529
- Joined: Mon 06 Feb 2006, 04:00:00
Re: BOGNONBR ?????????
![]() by perdition79 » Sat 11 Oct 2008, 23:57:52
by perdition79 » Sat 11 Oct 2008, 23:57:52
$this->bbcode_second_pass_quote('Dreamtwister', 'T')hat first image is scary as hell. I mean, I've seen some scary crap posted here before, but that chart...I can't even describe it.
Even if you ignore all the money the banks borrowed, just the fact that the Federal Reserve is lending hundreds of billions of dollars that they don't have is scary. If that isn't slamming into a brick wall at 500 mph, I don't know what is.
http://www.thepeoplescube.com/
"We are building a religion; we are building it bigger. We are widening the corridors and adding more lanes."
Cake - Comfort Eagle
"We are building a religion; we are building it bigger. We are widening the corridors and adding more lanes."
Cake - Comfort Eagle
-

perdition79 - Tar Sands

- Posts: 553
- Joined: Fri 21 Apr 2006, 03:00:00
- Location: Babylon
Re: BOGNONBR ?????????
![]() by seldom_seen » Sun 12 Oct 2008, 00:21:25
by seldom_seen » Sun 12 Oct 2008, 00:21:25
That's the graph you're sure never to see on the NBC Today show, or all the other happy happy buy and spend consumer prozac channels.
They've been drilling in to our heads that it's a "liquidity crisis" and the banks just need to regain a lil' confidence and start lending to each other again. That's the graph though I think people are using to say...umm...excuse me...this is more than a liquidity crisis the banks are insolvent (aka broke).
"Non-Borrowed Reserves of Depository Institutions" is fancy talk for "Yo, pizon, you got any freakin cash?" The answer obviously being no. "Well pizon you owe a lot of freakin people a lotta freakin money. Hank don't like that. You saws what he did to Lehman and Bear Stearns. Don't make Hank send me back here."
- seldom_seen
- Intermediate Crude
- Posts: 2229
- Joined: Tue 12 Apr 2005, 03:00:00
Re: BOGNONBR ?????????
![]() by ReverseEngineer » Sun 12 Oct 2008, 00:31:11
by ReverseEngineer » Sun 12 Oct 2008, 00:31:11
Asymptotic approach to the Zero Point.
The graph here shows accurately what I have been trying to say in words, but having difficulty making people understand.
You get neither inflation or deflation resulting from this. You get collapse of the system.
The Debt has been pushed virtually to infinity, now the money supply is being pushed to infinity to compensate for that. Its meaningless numbers now, has no reflection to actual value of anything. Matter and Anti-Matter meet, result TOTAL ANNIHILIATION.
What of Lazarus?
Reverse Engineer
-

ReverseEngineer - Intermediate Crude
- Posts: 3352
- Joined: Wed 16 Jul 2008, 03:00:00
Re: BOGNONBR ?????????
![]() by TreebeardsUncle » Sun 12 Oct 2008, 00:58:13
by TreebeardsUncle » Sun 12 Oct 2008, 00:58:13
Ok.
This is critical. So, this means that the banks are beyond undercapitalized. The ratio of debt to equity is beyond 30:1 or so?
That means that the amount due to be paid back far exceeds their assets. Many of the banks will have to be nationalized. Think WFB and JP Morgan are still in good shape but BofA and Citibank may be insolvent.
Comments?
g
- TreebeardsUncle
- Tar Sands
- Posts: 683
- Joined: Thu 15 Jun 2006, 03:00:00
Re: BOGNONBR ?????????
![]() by TheDude » Sun 12 Oct 2008, 01:06:38
by TheDude » Sun 12 Oct 2008, 01:06:38
The general consensus seems to be Insolvency.
Now, where have I seen another chart depicting value of something reaching Escape Velocity on a relative scale? Hmmm...

You might say the recent downturn would make this a hockey stick with a big splinter in its bottom, but how much of a blow to the chin has world GDP taken lately too, pizon?

Now, where have I seen another chart depicting value of something reaching Escape Velocity on a relative scale? Hmmm...
You might say the recent downturn would make this a hockey stick with a big splinter in its bottom, but how much of a blow to the chin has world GDP taken lately too, pizon?
Cogito, ergo non satis bibivi
And let me tell you something: I dig your work.
And let me tell you something: I dig your work.
-
TheDude - Expert
- Posts: 4896
- Joined: Thu 06 Apr 2006, 03:00:00
- Location: 3 miles NW of Champoeg, Republic of Cascadia
Re: BOGNONBR ?????????
![]() by CrudeAwakening » Sun 12 Oct 2008, 01:44:21
by CrudeAwakening » Sun 12 Oct 2008, 01:44:21
It's a result of the Term Auction Facility (TAF) program, where the Fed loaned reserves against a wider range of collateral than was previously possible.
The Fed sterilized this increase in reserves by selling treasuries via its open market operations, which caused a roughly offsetting decrease in non-borrowed reserves.
In other words, they took 'non-borrowed' fed funds out of the system, and put 'borrowed' funds into the system. Reserves were reclassified from non-borrowed to borrowed, a consequence of the Fed lending reserves to banks and permanently withdrawing reserves simulatenously.
It doesn't mean, in and of itself, that banks are undercapitalised (though I'm sure many of them are). The fact that they've had to resort to all these accounting shenanigans to keep things afloat is a reflection of the dire straits the banking system is in, though.
"Who knows what the Second Law of Thermodynamics will be like in a hundred years?" - Economist speaking during planning for World Population Conference in early 1970s
-

CrudeAwakening - Tar Sands
- Posts: 834
- Joined: Tue 28 Jun 2005, 03:00:00
Re: BOGNONBR ?????????
![]() by pedalling_faster » Sun 12 Oct 2008, 07:23:48
by pedalling_faster » Sun 12 Oct 2008, 07:23:48
non borrowed reserves, another image
maybe this is clearer.
well, at least they updated it. the last curve was frozen at -$125 billion for a few months, when all sorts of stuff was happening.
-$190 billion.
earlier this year, February maybe, it was -$15 billion, with the same curve shape - going off a cliff.
so the rate of decrease is, about -$60 billion every 3 months. starting at about 0 January 2008.
i haven't heard a single financial writer/ journalist talk about it. you'd think one of them would have a go.
they might need to start using logarithmic paper. it would make it easier to read.
i'm surprised they publish it. but since they do -
EXCRESNS, Excess Reserves of Depository Institutions

RSBKCRNS, Reserve Bank Credit

TOTBORR, Total Borrowings of Depository Institutions from the Federal Reserve

maybe this is clearer.
well, at least they updated it. the last curve was frozen at -$125 billion for a few months, when all sorts of stuff was happening.
-$190 billion.
earlier this year, February maybe, it was -$15 billion, with the same curve shape - going off a cliff.
so the rate of decrease is, about -$60 billion every 3 months. starting at about 0 January 2008.
i haven't heard a single financial writer/ journalist talk about it. you'd think one of them would have a go.
they might need to start using logarithmic paper. it would make it easier to read.
i'm surprised they publish it. but since they do -
EXCRESNS, Excess Reserves of Depository Institutions
RSBKCRNS, Reserve Bank Credit
TOTBORR, Total Borrowings of Depository Institutions from the Federal Reserve
http://www.LASIK-Flap.com/ ~ Health Warning about LASIK Eye Surgery
-
pedalling_faster - Permanently Banned
- Posts: 1399
- Joined: Sat 10 Dec 2005, 04:00:00
Re: BOGNONBR ?????????
![]() by TheDude » Sun 12 Oct 2008, 08:18:33
by TheDude » Sun 12 Oct 2008, 08:18:33
Good God, anybody catch this on Bloomberg.com: Worldwide?
$this->bbcode_second_pass_quote('', 'F')annie and Freddie began notifying bond traders last week that each company needs to buy $20 billion a month in mostly subprime, Alt-A and non-performing prime mortgage securities, according to the people, who asked not to be identified because the plans are confidential. The purchases would be separate from the U.S. Treasury's $700 billion Troubled Asset Relief Program.
The Federal Housing Finance Agency, which placed the two companies in conservatorship on Sept. 7, directed them last month to start increasing their purchases of loans and mortgage-backed securities as the Treasury seeks to absorb underperforming and illiquid assets from financial companies.
No wonder Rocc retired! This is tantamount to another Iraq War - Plus!
Cogito, ergo non satis bibivi
And let me tell you something: I dig your work.
And let me tell you something: I dig your work.
-
TheDude - Expert
- Posts: 4896
- Joined: Thu 06 Apr 2006, 03:00:00
- Location: 3 miles NW of Champoeg, Republic of Cascadia


