$this->bbcode_second_pass_quote('AirlinePilot', 'O')F,you have posted here many times about total liquids as if that is OIL. Total liquids is NOT oil, yet you continue to barrage these forums with some delusional idea that total liquids increases means something.
Deny that.


PeakOil is You
THE Bakken Thread pt 3 (merged)
Re: Whipple: Parsing the Bakken, 82 b/day
![]() by copious.abundance » Tue 27 Mar 2012, 02:20:05
by copious.abundance » Tue 27 Mar 2012, 02:20:05
Breaking news: Every peak oil website reports total liquids production! Even peaker website run by the peakers themselves do it. The reason I'm citing all-liquids production, is because they are citing all-liquids production. But that doesn't mean I believe all-liquids is oil, anymore than people on TOD believe all-liquids is oil even as they post charts on its production.
And in case you haven't noticed, I've also been working on a thread with news of crude and condensate only production. But I dunno, maybe you aren't paying attention.

Stuff for doomers to contemplate:
http://peakoil.com/forums/post1190117.html#p1190117
http://peakoil.com/forums/post1193930.html#p1193930
http://peakoil.com/forums/post1206767.html#p1206767
http://peakoil.com/forums/post1190117.html#p1190117
http://peakoil.com/forums/post1193930.html#p1193930
http://peakoil.com/forums/post1206767.html#p1206767
-

copious.abundance - Fission

- Posts: 9589
- Joined: Wed 26 Mar 2008, 03:00:00
- Location: Cornucopia
Re: Whipple: Parsing the Bakken, 82 b/day
![]() by copious.abundance » Tue 27 Mar 2012, 02:27:16
by copious.abundance » Tue 27 Mar 2012, 02:27:16
This is really funny ... here on this very website on the What is Peak Oil? page, we find a chart showing ... all-liquids production and projections!! 


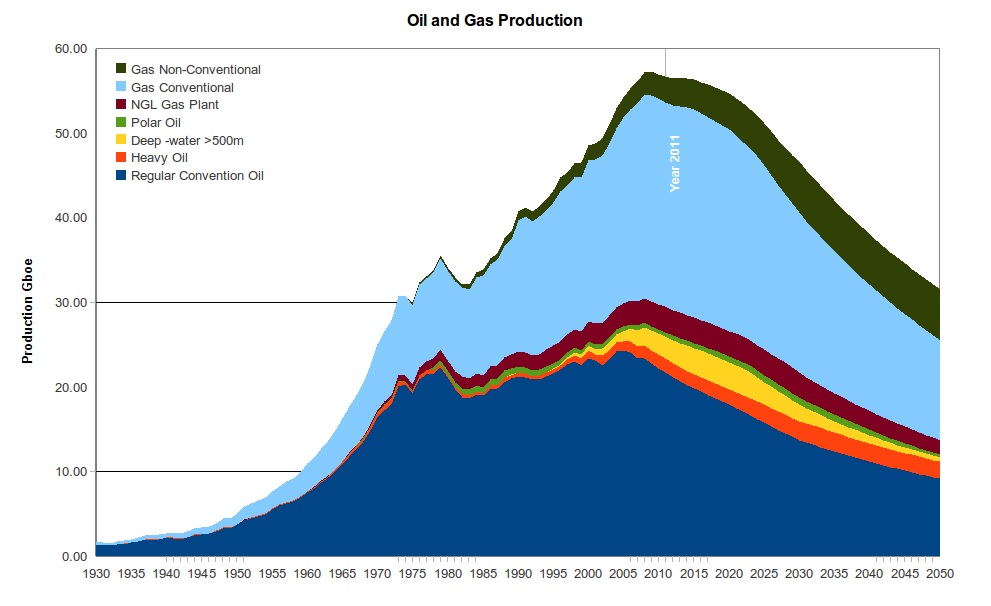
You gotta lot of nerve accusing me of posting information on all-liquids production when this very website does the exact same thing on its "What is peak oil page!  In fact, that chart goes even farther than I have and includes natural gas. *shakes head*
You gotta lot of nerve accusing me of posting information on all-liquids production when this very website does the exact same thing on its "What is peak oil page!
In fact, that chart goes even farther than I have and includes natural gas. *shakes head*Stuff for doomers to contemplate:
http://peakoil.com/forums/post1190117.html#p1190117
http://peakoil.com/forums/post1193930.html#p1193930
http://peakoil.com/forums/post1206767.html#p1206767
http://peakoil.com/forums/post1190117.html#p1190117
http://peakoil.com/forums/post1193930.html#p1193930
http://peakoil.com/forums/post1206767.html#p1206767
-
copious.abundance - Fission
- Posts: 9589
- Joined: Wed 26 Mar 2008, 03:00:00
- Location: Cornucopia
Re: Whipple: Parsing the Bakken, 82 b/day
![]() by AirlinePilot » Wed 28 Mar 2012, 00:23:33
by AirlinePilot » Wed 28 Mar 2012, 00:23:33
The problem OF is you keep using it (total liquids) as some sort of gauge that we aren't at peak or even near one. By all measures since late 04 we are struggling to increase C&C by very small amounts. You have posted the total liquids chart MANY times and the implication is that all is going to be well. Oil production continues to climb! If you dont THINK you have been doing that then I suggest you rethink your posting style and truly read what others are saying back to you.
Your perceived here as a childish, shrill, troll who seems incapable of grasping what the difference between total liquids are and C&C.
IT MATTERS..no matter how many times you say it doesn't
Your perceived here as a childish, shrill, troll who seems incapable of grasping what the difference between total liquids are and C&C.
IT MATTERS..no matter how many times you say it doesn't
-

AirlinePilot - Moderator

- Posts: 4378
- Joined: Tue 05 Apr 2005, 03:00:00
- Location: South of Atlanta
Re: Whipple: Parsing the Bakken, 82 b/day
![]() by copious.abundance » Wed 28 Mar 2012, 00:58:26
by copious.abundance » Wed 28 Mar 2012, 00:58:26
$this->bbcode_second_pass_quote('AirlinePilot', 'T')he problem OF is you keep using it (total liquids) as some sort of gauge that we aren't at peak or even near one.
Not, it is not me. I'm just repeating what the peak oil websites - including this one - have been doing for years.
$this->bbcode_second_pass_quote('AirlinePilot', 'Y')ou have posted the total liquids chart MANY times and the implication is that all is going to be well.
No, it is not me. I'm just repeating what the peak oil websites - including this one - have been doing for years.
$this->bbcode_second_pass_quote('AirlinePilot', 'Y')our [sic] perceived here as a childish, shrill, troll who seems incapable of grasping what the difference between total liquids are and C&C.
Breaking news AP: I'm just repeating what the peak oil websites - including this one - have been doing for years.
Oh, and speaking of childish ... click here. Or, maybe "childish" isn't the right word, but "cowardly" would sure hit the spot.
$this->bbcode_second_pass_quote('AirlinePilot', 'I')T MATTERS..no matter how many times you say it doesn't
Don't tell that it matters to me - tell that to all the peak oil websites -including this one - who have been posting all-liquids production figures for years. I'm just repeating what they've been doing the whole time.
Stuff for doomers to contemplate:
http://peakoil.com/forums/post1190117.html#p1190117
http://peakoil.com/forums/post1193930.html#p1193930
http://peakoil.com/forums/post1206767.html#p1206767
http://peakoil.com/forums/post1190117.html#p1190117
http://peakoil.com/forums/post1193930.html#p1193930
http://peakoil.com/forums/post1206767.html#p1206767
-
copious.abundance - Fission
- Posts: 9589
- Joined: Wed 26 Mar 2008, 03:00:00
- Location: Cornucopia


![[smilie=5bowtie.gif]](https://udev.peakoil.com/forums/images/smilies/5bowtie.gif "5bowtie")
