Well, I've been waiting for someone to mention this bit of trivia but amidst "Peak Demand", "New Technology", "Huge Discoveries", "Renewables Explode" "Economy Expands" and all the other happy news, the global average oil price broke the all time record last year.
Or as Mr. Corny himself puts it:
$this->bbcode_second_pass_quote('Daniel Yergin', '[')b]“Quite simply, we are looking at the highest average price since the age of oil began.”


PeakOil is You
All Time Record Yearly Global Oil Price
All Time Record Yearly Global Oil Price
![]() by Pops » Fri 13 Jan 2012, 16:49:30
by Pops » Fri 13 Jan 2012, 16:49:30

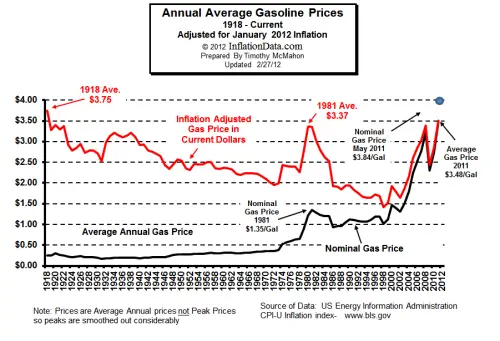
Well, almost all-time, you need to go back to the '60's to find a higher average price - that's 1860.

Heres a better image of the 1860-2007 chart and yeah, those are inflation adjusted prices.
Oh, and there's this...
The legitimate object of government, is to do for a community of people, whatever they need to have done, but can not do, at all, or can not, so well do, for themselves -- in their separate, and individual capacities.
-- Abraham Lincoln, Fragment on Government (July 1, 1854)
-- Abraham Lincoln, Fragment on Government (July 1, 1854)
-

Pops - Elite

- Posts: 19746
- Joined: Sat 03 Apr 2004, 04:00:00
- Location: QuikSac for a 6-Pac
Re: All Time Record Yearly Global Oil Price
![]() by Pops » Fri 13 Jan 2012, 16:56:05
by Pops » Fri 13 Jan 2012, 16:56:05
Oops, gotta make it official
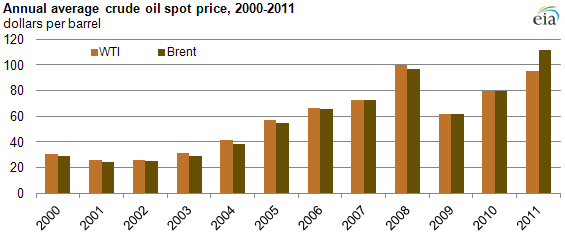
$this->bbcode_second_pass_quote('', 'T')he crude oil markets sustained high price levels in 2011, as the spot price of Brent averaged $111.26 per barrel, marking the first time the global benchmark averaged more than $100 per barrel for a year (see chart above).
$this->bbcode_second_pass_quote('', 'T')he crude oil markets sustained high price levels in 2011, as the spot price of Brent averaged $111.26 per barrel, marking the first time the global benchmark averaged more than $100 per barrel for a year (see chart above).
http://www.eia.gov/todayinenergy/detail.cfm?id=4550
The legitimate object of government, is to do for a community of people, whatever they need to have done, but can not do, at all, or can not, so well do, for themselves -- in their separate, and individual capacities.
-- Abraham Lincoln, Fragment on Government (July 1, 1854)
-- Abraham Lincoln, Fragment on Government (July 1, 1854)
-
Pops - Elite
- Posts: 19746
- Joined: Sat 03 Apr 2004, 04:00:00
- Location: QuikSac for a 6-Pac
Re: All Time Record Yearly Global Oil Price
![]() by SeaGypsy » Fri 13 Jan 2012, 23:17:16
by SeaGypsy » Fri 13 Jan 2012, 23:17:16
That was in the back of my brain somewhere, thanks for mapping it out here Pops.
I am predicting approximately a $6 lift in the top price and a buck or 2 for close/ average for the year 2012. If I am right again this year will beat last and so on for the forseeable.
Interesting how we can be blindsided by spot prices.
I am predicting approximately a $6 lift in the top price and a buck or 2 for close/ average for the year 2012. If I am right again this year will beat last and so on for the forseeable.
Interesting how we can be blindsided by spot prices.
- SeaGypsy
- Master Prognosticator

- Posts: 9285
- Joined: Wed 04 Feb 2009, 04:00:00
Re: All Time Record Yearly Global Oil Price
![]() by SeaGypsy » Fri 13 Jan 2012, 23:33:56
by SeaGypsy » Fri 13 Jan 2012, 23:33:56
If you take out 08 & 09 as anomalies due to the US RE bubble popping the chart shows the trend I have been working on to win the price challenge the last 2 years. How fast can the price continue to rise at this pace? Call it 5-10% after inflation is adjusted. Compound interest is a killer.
- SeaGypsy
- Master Prognosticator
- Posts: 9285
- Joined: Wed 04 Feb 2009, 04:00:00
Re: All Time Record Yearly Global Oil Price
![]() by Plantagenet » Fri 13 Jan 2012, 23:59:16
by Plantagenet » Fri 13 Jan 2012, 23:59:16
The all-time record oil price is the reason why the EU is in recession and China's growth is slowing. High energy prices are the reason why here in the US, in spite of trillions in porkulus and QE1, 2 and 3, the economy can't seem to get going.
I wonder when Obama and the other big-spender dopes in DC will stop worshipping at the alter of Keynesism, and figure out that more government spending isn't going to fix our problems. In the post-peak oil world, the most important thing affecting the economy today is the relationship between oil prices and economic growth.
Every $10 increase in oil price cuts global GDP by about 0.5%.

John Maynard Keynes had no idea of the importance of energy prices in the economy
I wonder when Obama and the other big-spender dopes in DC will stop worshipping at the alter of Keynesism, and figure out that more government spending isn't going to fix our problems. In the post-peak oil world, the most important thing affecting the economy today is the relationship between oil prices and economic growth.
Every $10 increase in oil price cuts global GDP by about 0.5%.
John Maynard Keynes had no idea of the importance of energy prices in the economy
-

Plantagenet - Expert
- Posts: 26765
- Joined: Mon 09 Apr 2007, 03:00:00
- Location: Alaska (its much bigger than Texas).
Re: All Time Record Yearly Global Oil Price
![]() by ColossalContrarian » Sat 14 Jan 2012, 01:32:22
by ColossalContrarian » Sat 14 Jan 2012, 01:32:22
That’s why I love this website, easily understandable common sense replies and textbook graphs a middle-school student can understand.
- ColossalContrarian
- Heavy Crude

- Posts: 1374
- Joined: Tue 20 Jun 2006, 03:00:00
Re: All Time Record Yearly Global Oil Price
![]() by dolanbaker » Sat 14 Jan 2012, 03:50:12
by dolanbaker » Sat 14 Jan 2012, 03:50:12
$this->bbcode_second_pass_quote('Plantagenet', 'I')n the post-peak oil world, the most important thing affecting the economy today is the relationship between oil prices and economic growth.
John Maynard Keynes had no idea of the importance of energy prices in the economy
John Maynard Keynes had no idea of the importance of energy prices in the economy
Most mid 20th century economists assumed infinite cheap energy and based their ideas around that concept. In the 1960s, electricity was supposed to become too cheap to meter for example.
We are now long overdue a change in direction that reflects the new realities that we face.
I suspect that it will take a global meltdown to achieve this change.
The emerging economies are, of course better equipped to work with high oil prices due to the fact that their citizens use far less oil than those of the developed world. Most of their citizens will never achieve a western lifestyle because the oil price is so high, we will just see a continuation in the trend of the developed countries drifting down to the level of the third world nations.
Religion is regarded by the common people as true, by the wise as false, and by rulers as useful.:Anonymous
Our whole economy is based on planned obsolescence.
Hungrymoggy "I am now predicting that Europe will NUKE ITSELF sometime in the first week of January"
Our whole economy is based on planned obsolescence.
Hungrymoggy "I am now predicting that Europe will NUKE ITSELF sometime in the first week of January"
-

dolanbaker - Intermediate Crude

- Posts: 3855
- Joined: Wed 14 Apr 2010, 10:38:47
- Location: Éire
Re: All Time Record Yearly Global Oil Price
![]() by ryzaM » Thu 16 Feb 2012, 02:52:10
by ryzaM » Thu 16 Feb 2012, 02:52:10
I agree with you. It seems rising in gas price has been part of the individual lives in the whole year round. I've read these article Gas prices will continue to rise, according to it the recent survey says, the price of North Sea Brent crude oil has increased by $7 a 42-gallon barrel in the last two months. These price increase was blamed on the volatility in the Middle East is considered responsible for the wholesale price. Another reason was those Middle Eastern tensions include threats by Iran to block vital shipping lanes, still the higher cost of summer-grade fuel and a decreased refinery capacity They have risen by the pumps across the nation. And now the reduction in consumer spending at the pumps also worries some economists. Consumer spending is necessary for the economy to improve and recover. Using the gas for the better consumption still the best thing to do.
- ryzaM
- Wood

- Posts: 1
- Joined: Thu 16 Feb 2012, 02:41:02
Re: All Time Record Yearly Global Oil Price
![]() by margaretB » Thu 16 Feb 2012, 04:21:30
by margaretB » Thu 16 Feb 2012, 04:21:30
High gas prices are usually caused by high prices for crude oil, which accounts for 55% of the price of gasoline. This year, concerns about a potential military action, by either Israel or even the U.S., against Iran are causing oil prices to creep up.
- margaretB
- Wood
- Posts: 4
- Joined: Thu 16 Feb 2012, 03:48:10
Re: All Time Record Yearly Global Oil Price
![]() by meemoe_uk » Thu 16 Feb 2012, 07:33:40
by meemoe_uk » Thu 16 Feb 2012, 07:33:40
Using inflation adjusted figures is better than non adjusted. But it still falls way short of charting the true cost of oil. In the 70s oil crisis, people couldn't buy gasoline, not because the price was too high, but because there was no gasoline at the pump. A consumer had to barter and haggle with those that had it. So which is more expensive?
Also, the Purchasing Power Parity, a standard of assessing the true cost of a commodity, simply hasn't entered the lexicon on this forum.
In 1997, oil was $12 a barrel
In 2011, WTI Crude Oil is $86, and Brent Crude about $103. About a 9-fold increase in 14 years.
but
In 1970, oil was $1 a barrel
In 1979, oil was $37 a barrel. About a 37-fold increase in 9 years.
The 70s oil shock was measurably 6.4 times harder than today's so called oil crisis. Together with the fact that the peak oil is now hypers ignore PPP, and that me and everyone I know doesn't find gasoline prices to be crippling, strikes me that the true cost of oil today is much cheaper than before.
-

meemoe_uk - Tar Sands

- Posts: 948
- Joined: Tue 22 May 2007, 03:00:00
Re: All Time Record Yearly Global Oil Price
![]() by dolanbaker » Thu 16 Feb 2012, 07:47:44
by dolanbaker » Thu 16 Feb 2012, 07:47:44
$this->bbcode_second_pass_quote('meemoe_uk', 'U')sing inflation adjusted figures is better than non adjusted. But it still falls way short of charting the true cost of oil. In the 70s oil crisis, people couldn't buy gasoline, not because the price was too high, but because there was no gasoline at the pump. A consumer had to barter and haggle with those that had it. So which is more expensive?
Also, the Purchasing Power Parity, a standard of assessing the true cost of a commodity, simply hasn't entered the lexicon on this forum.
In 1997, oil was $12 a barrel
In 2011, WTI Crude Oil is $86, and Brent Crude about $103. About a 9-fold increase in 14 years.
but
In 1970, oil was $1 a barrel
In 1979, oil was $37 a barrel. About a 37-fold increase in 9 years.
The 70s oil shock was measurably 6.4 times harder than today's so called oil crisis. Together with the fact that the peak oil is now hypers ignore PPP, strikes me that the true cost of oil today is much cheaper than before.
OK so are you going to complete the picture with the relative inflation rates over the same time periods as well.
I seem to remember that the 1970s were the decade of inflation and the 1997 - 2011 as a period of relatively low inflation.
Religion is regarded by the common people as true, by the wise as false, and by rulers as useful.:Anonymous
Our whole economy is based on planned obsolescence.
Hungrymoggy "I am now predicting that Europe will NUKE ITSELF sometime in the first week of January"
Our whole economy is based on planned obsolescence.
Hungrymoggy "I am now predicting that Europe will NUKE ITSELF sometime in the first week of January"
-
dolanbaker - Intermediate Crude
- Posts: 3855
- Joined: Wed 14 Apr 2010, 10:38:47
- Location: Éire
