
One of the most valuable assets on Earth, oil has a great impact on the global financial market. The price of oil depends on a large variety of factors, and this definitive guide explains what exactly drives the value of this resource. We will take a detailed look at the history of oil price formation, find out who produces it, and discuss a few aspects which play a role in the oil market.
The History of Oil and Its Price
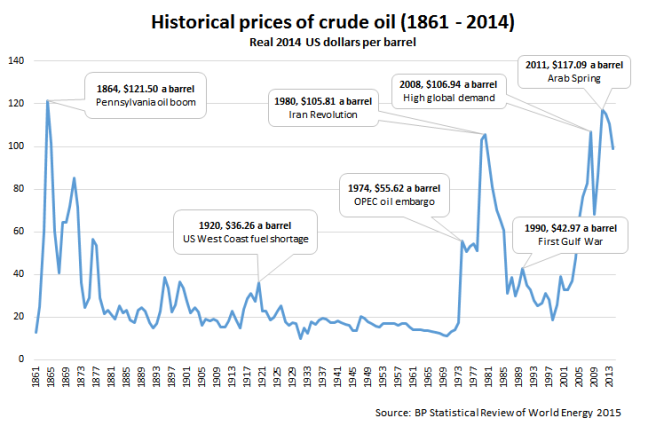 History of oil price in 1861-2014
Before we plunge into the long history of oil price formation, let’s overview the major milestones in oil production until the Second World War:
- About 3 thousand years B.C., people in the Middle East are starting to use oil as fuel, for the manufacture of weapons, for fixtures and building material (bitumen, asphalt). Oil was collected from the surface of open water.
- 347 A.D. In China, for the first time, wells were drilled in the ground for oil. As pipes, hollow bamboo trunks were used.
- 7th century A.D. In Byzantium or Persia, the “Greek fire,” the superweapon of that time, was made on the basis of oil.
- 1264. The Italian traveler Marco Polo, driving through the territory of modern Azerbaijan, said that local residents collected oil leaking from the ground. Around the same time, oil trade began.
- About 1500. In Poland, oil was first used for street lighting. Oil was exported from the Carpathian region.
- 1848. The world’s first modern-type oil well was drilled on the Absheron Peninsula near Baku.
- 1849. Canadian geologist Abraham Gesner \ Abraham Gesner first received kerosene. In 1857, a kerosene lamp was invented. This invention made it possible to preserve the world stock of whales, since kerosene, which replaced whale oil, has become a more popular and convenient source of energy for lighting homes. Before the mass production of kerosene, a gallon (about 4 liters) of whale fat cost about $ 1.77. After the mass adoption of kerosene lamps, the price dropped to $ 0.40 – kerosene sold at a price of $ 0.07 per gallon. The world whaling industry is in deep crisis.
- 1859. The beginning of oil production in the USA. The first well (21 meters deep) was drilled in the state of Pennsylvania. She allowed producing 15 barrels of oil per day.
- 1962. People started measuring oil in barrels because it was transported in such containers. A barrel of oil is 42 gallons (about 4 liters per gallon).
- 1870. The first attempt to create an oil monopoly. John Rockefeller founded the Standard Oil company, which led to the adoption of the world’s first antitrust law in the United States. In 1911, the US Supreme Court decided to divide Standard Oil into 39 small companies to prevent the monopolism in the oil sector.
- 1878. Edison invented the light bulb. The massive electrification of cities and a decrease in kerosene consumption for a short time plunged the global oil industry into a state of depression.
- 1886. German engineers Karl Benz and Wilhelm Daimler created a car powered by a gasoline engine. Previously, gas was only a by-product of the production of kerosene.
- 1890. German engineer Rudolf Diesel invented a diesel engine capable of operating on by-products of oil refining. Today, most industrial countries are actively restricting the use of diesel engines, which causes significant damage to the environment.
- 1896. Henry Ford created his first car. Oil started being primarily considered as a raw material for the production of gasoline.
- 1903. The first flight of the plane performed by the Wright brothers. Since the 1920s, oil is used for aircraft.
- 1904. The largest oil-producing countries were the United States, Russia, Indonesia, Austria-Hungary, Romania, and India.
- 1908. The first oil fields in Iran were discovered. The Anglo-Persian Oil Company was established (which later turned into British Petroleum).
- 1914-1918. World War I – the fight for the control of oil fields.
- 1918. For the first time in the world, Soviet Russia nationalized oil companies.
- 1932. Oil fields discovered in Bahrain.
- 1938. Oil fields are discovered in Kuwait and Saudi Arabia.
- 1939-1945. The Second World War. Germany failed to gain control of oil fields in Romania, the Trans Caucasus, and the Middle East.
After World War II
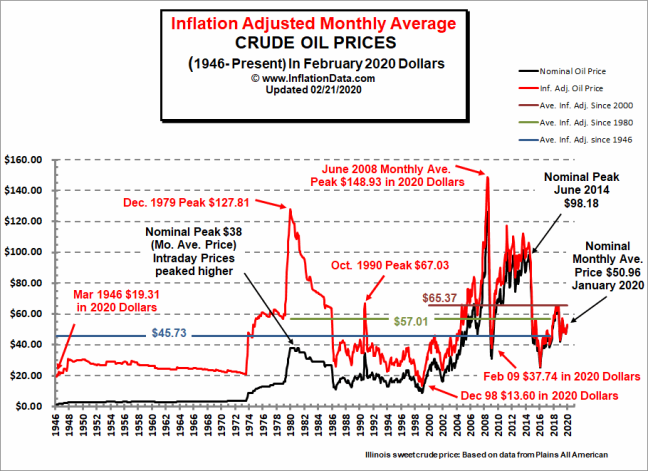 Crude oil price after World War II
From 1948 through the finish of the 1960s, crude oil prices ran somewhere in the range of $2.50 and $3.00. The value oil rose from $2.50 in 1948 to about $3.00 in 1957. When seen in 2010 dollars, an alternate story develops with raw oil costs fluctuating somewhere in the range of $17 and $19 during the greater part of the period. The clear 20% cost increase in nominal cos simply kept up with inflation.
From 1958 to 1970, costs were steady close to $3.00 per barrel; however, in genuine terms, the cost of raw petroleum declined from $19 to $14 per barrel. Not exclusively was the cost of rough lower when balanced for expansion, however, in 1971 and 1972, the universal maker endured the extra impact of a more fragile US dollar.
OPEC was built up in 1960 with five founding members: Iran, Iraq, Kuwait, Saudi Arabia, and Venezuela. Two of the delegates at the initial gatherings recently considered the Texas Railroad Commission’s strategy for controlling cost through impediments on creation. Before the finish of 1971, six different countries had joined the group: Qatar, Indonesia, Libya, United Arab Emirates, Algeria, and Nigeria. From the establishment of the Organization of Petroleum Exporting Countries through 1972, these countries experienced a consistent decrease in the buying power of a barrel of oil.
It took OPEC 10 years from the moment of its foundation to understand the degree of its power over oil price formation.
In 1972, the cost of raw petroleum was beneath $3.50 per barrel. The Yom Kippur War began with an assault on Israel by Syria and Egypt on October 5, 1973. While these countries diminished creation by 5,000,000 barrels for each day, different nations had the option to build creation by a million barrels. Before the finish of 1974, the ostensible cost of oil had quadrupled to more than $12.00. The extraordinary affectability of costs to flexibly deficiencies, turned into very clear when costs expanded 400 percent in six brief months.
From 1974 to 1978, the world raw petroleum cost was keeping in the range from $12.52 per barrel to $14.57 per barrel. At the point when balanced at expansion, world oil costs were in a time of moderate decrease. During that period, OPEC limit and creation was moderately level close to 30 million barrels for each day.
1980-90’s
In 1979 and 1980, occasions in Iran and Iraq prompted another round of unrefined petroleum cost increments. The Iranian upset brought about the loss of 2.0-2.5 million barrels for every day of oil creation between November 1978 and June 1979. At a certain point, oil production nearly stopped.
The Iranian transformation was the proximate reason for the highest oil prices in post-WWII history. However, this effect was somewhat limited. In September 1980, Iran, previously weakened by the social unrest, was attacked by Iraq. In November, the joined creation of the two nations was just a million barrels per day. As an outcome, overall unrefined petroleum creation was 10% lower than in 1979.
The loss of production volume and the Iraq-Iran War caused raw petroleum costs to increase dramatically. The nominal cost went from $14 in 1978 to $35 per barrel in 1981.
The fast increment in unrefined costs from 1973 to 1981 would have been less was it not for the United States that decided to control the prices. The undeniable consequence of the value controls was that U.S. consumers paid around 50% more for imports than domestic production, and U.S. producers earned way less than international players.
During 1979-1980, when prices were growing insanely, Saudi Arabia’s oil minister Ahmed Yamani cautioned different individuals from OPEC that high prices will lower the demand, but no one listened to him. The increase in oil price forced people to adapt to new conditions:
- Better insulation in houses;
- More energy efficiency on production facilities;
- Stronger, more efficient cars.
All that caused the reduction of oil consumption.
From 1980 to 1986, non-OPEC creation expanded 6 million barrels every day. From 1982 to 1985, OPEC endeavored to set production quotas to make prices stable.
By mid-1986, Saudi Arabia expanded creation from 2,000,000 barrels for every day to 5,000,000. Raw petroleum costs plunged, falling underneath $10 per barrel by mid-1986. In spite of the fall in costs, Saudi income stayed about the same with higher volumes making up at lower costs.
In December 1986, OPEC strived to set the target of $18 per barrel but was breaking down by January of 1987, and costs stayed frail. The cost of raw petroleum spiked in 1990 with the lower creation, vulnerability related to the Iraqi intrusion of Kuwait, and the resulting Gulf War.
Following what got known as the Gulf War to free Kuwait, raw petroleum costs entered a time of consistent decrease. In 1994, the swelling balanced oil cost arrived at the most minimal level since 1973.
1990’s
The price cycle at that point turned up. The United States economy was stable, and the Asian Pacific locale was blasting. From 1990 to 1997, world oil utilization expanded to 6.2 million barrels every day. Asian utilization represented everything except 300,000 barrels for every day of that increase and added to a cost recuperation that reached out into 1997. Declining Russian creation added to the value recuperation. Somewhere in the range of 1990 and 1996, Russian creation declined in excess of 5,000,000 barrels every day.
The cost expands reached a fast conclusion in 1997 and 1998 when the effect of the financial emergency in Asia was either overlooked by OPEC.
Costs started to recuperate in mid-1999. In April, OPEC diminished production quotas by another 1.719 million barrels. Although not all produced managed to follow the quota, between mid-1998 and the middle of 1999, OPEC creation dropped by around 3,000,000 barrels for every day. Such restrictions managed to move costs above $25 per barrel.
XXI century
In 2001, a debilitated US economy and increments in non-OPEC creation put a descending focus on costs. OPEC started the series of cuts and reduced the production rate by 3.5 million barrels by September 1, 2001. Without the September 11, 2001, terrorist attacks, this would have been enough to converse the descending pattern on the market.
Not long after the assault, oil costs dove. OPEC and some Russian makers chose to cut the creation. This had the ideal impact with oil costs moving into the $25 territory by March 2002. By year-end, oversupply was not an issue. Issues in Venezuela prompted a strike at PDVSA making Venezuelan creation fall. After that, OPEC expanded quotas by 2.8 million barrels for each day in January and February 2003.
Other major factors contributing to higher prices included a weak dollar and the rapid growth in Asian economies and their petroleum consumption.
 Oil consumption in China
In 2008, after the beginning of the longest U.S. recession since the Great Depression, the oil price continued to soar. Spare capacity dipped below a million barrels per day, and speculation in the crude oil futures market was exceptionally strong. Trading on NYMEX closed at a record $145.29 on July 3, 2008. In the face of recession and falling petroleum demand, the price fell throughout the remainder of the year to the below $40 in December.
The movement of oil price in 2010s together with related events is shown on the chart below:
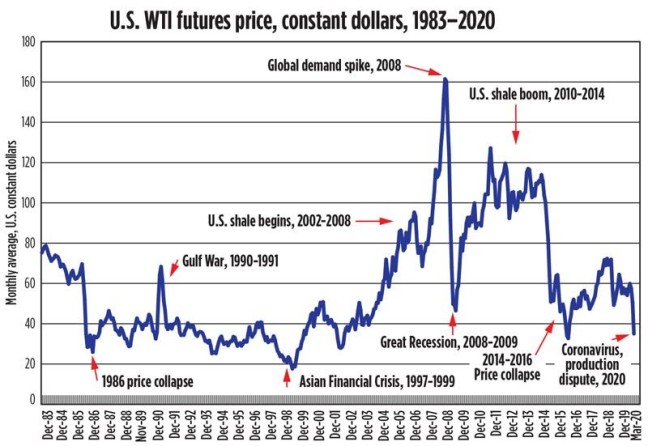 The cost of WTI futures in 1983-2020
Many economic experts may believe that the time of the lowest oil prices was in the early 1980s after the mid-1986 value breakdown. However, this point of view can be argued — the time of most minimal costs in dollars, was in late 1998 and mid-1999, during the Asian Financial Crisis. Indeed, the March 18, 2020, level of $20.37 is just surpassed by December 1998, January 1999, and February 1999 monthly average levels of $17.67, $19.45, and $18.69.
Where Is Oil Produced?
Oil-producing countries can be divided into four groups according to the share of the revenue from oil sales as part of gross domestic product (GDP):
- High share (43–49%) – Saudi Arabia, Kuwait, Qatar Nigeria;
- Medium share (17–27%) – Norway, Algeria, Venezuela, Iran;
- Small share (up to 10%) – Mexico, Indonesia, Malaysia, China;
- Minimal share – the USA (0.5%), the UK (1.5%), Australia (1.5%), Canada (3.4%).
Of course, oil revenues are most significant in OPEC countries (up to 60% of all export revenues).
The problem of many countries rich in natural resources, in particular oil (Venezuela, Nigeria, a number of other OPEC member countries), is that using these resources, the governments of these countries were not able to ensure long-term economic growth and a high standard of living. This phenomenon is called the “curse of natural resources.” The essence of this phenomenon is that there are certain correlation dependencies between the availability of natural resources and the rate of economic growth.
Amoco analysts estimate that the Gulf states contain two-thirds of the world’s oil reserves. The Gulf states in 2001 accounted for 22.8% of all US oil imports. Oil fields with 112.5 billion barrels of oil have been explored in Iraq. According to the BP Statistical Review of World Energy, Iraq has the second-largest oil reserves in the world, second only to Saudi Arabia (261.8 billion barrels). Kuwait’s reserves are estimated at 98.6 billion barrels, Iran – 89.7, Russia – 48.6. At the same time, the cost of Iraqi and Saudi oil is the lowest in the world.
How Is Oil Price Formed?
Throughout the entire 20th century, the cost of U.S. oil was regulated via the production and cost controls. After World War II time, U.S. oil costs at the wellhead arrived at the midpoint of $28.52 per barrel balanced for swelling to 2010 dollars. Without price control, the U.S. cost would have followed the world cost around $30.54.
Until recently, the global oil market was the seller’s market, and, as a result, the price of oil was determined on the basis of production costs in the worst fields, the operation of which is necessary for the satisfaction of demand.
Since Middle Eastern oil was the cheapest in terms of production costs, there was a continuous struggle between the countries-owners of subsoil and mining oil companies for the distribution of income. In the early stages, oil-producing countries received only payment for the use of irreplaceable natural resources (royalties) and part of the income tax. Subsequently, they were able to achieve equal profit sharing.
After the nationalization of the oil industry, oil-producing countries began to receive 80-90% income from oil production. But when the oil market turns from a seller’s market to a buyer’s market, the pricing principles also change. The price of oil is built on the principle of “netback,” i.e., “reverse account” prices: the costs of refining and transporting oil to the refinery, insurance costs, and other costs associated with the stages of transportation and refining are excluded from the price of petroleum products. A similar pricing method made it possible to link the prices of interchangeable energy carriers (coal, gas, fuel oil).
At the present stage, prices are determined on exchanges from the ratio of supply and demand, as well as taking into account many other factors (political, financial, technological, oil reserves, etc.). Even weather conditions (for example, cold and warm winters), the ratio of prices for currency, gold, etc. can affect oil prices.
 Events that define the cost of oil
Prices are determined on three major exchanges (New York, London, Singapore). The main types of contracts are futures and options; short-term forward contracts and swap transactions (with interchangeable delivery) are also used.
The most significant factors which should be considered to figure out the cost of oil are:
- The rate of change in GDP;
- Scientific and technological progress (new technologies, materials, means of communication, alternative energy sources, etc.);
- The state and forecast of reliable and potential oil reserves;
- Free oil production capacities in a number of countries, primarily in OPEC member countries.
- Institutional changes in the oil sector, as well as changes in oil legislation;
- The level of stocks in bunkers and storage facilities;
- Changes in exchange rates, etc.
The role of less significant factors in the globalization of the economy is changing markedly. While in the period up to 1998, the influence of political factors on oil supply was very significant (OPEC embargo policy, military conflicts in the Middle East), the oil shock of a later period has a different nature. Here, changes in the exchange rate, interest rates on loans, and the wide participation of financial institutions in world oil trade become more noticeable.
The rate of change in strategic and commercial oil reserves in the United States has become another significant factor, announced in the USA intentions to reduce or increase the size of reserves immediately receive a response on the exchanges, while the ratio of supply and demand requires detailed calculations.
The rise in prices is also affected by the high utilization of world oil refining capacities. In 70–90 years, when the degree of utilization of oil refining capacities was 70–80%, this factor was not taken into account. But since 2004, the utilization capacity of American refineries has exceeded 91%, Canadian – 97%, Mexican – 98%. The optimal load level for a market economy is considered to be 85–90% and the load level is 95% (achieved in the USA in 2005).
Is It Easy to Predict Oil Price?
The short answer is ‘No.’ When forecasting oil prices, you should mind that:
- Oil is a special product, the prices of which do not heavily depend on such things as the magnitude from the real costs of production and other objective components of its value;
- The dynamics of the interaction of factors affecting the value of the price is still hard to predict even for the expert traders’ community;
- So far, no integrated system of regulation of the oil market exists, so it’s impossible to synchronize the interests of key producers and consumers of goods, transit countries;
- Market predictability is not ensured by the development of acceptable price ranges;
- Most specialists failed to predict the single “sharp” price turn correctly (price rise during the first (1974) and second (1974–80) waves of the energy crisis, as well as price fall in 1986 and 1998 and unstoppable price increase in 2008
Bottom Line
As the modern world consumes more and more energy, each new barrel of oil is more expensive than the previous one – after all, the ‘easiest’ oil in production has already been pumped out and used. Based on this observation, the concept of “oil peak” was introduced: it states that at some point, production will peak and decline due to the depletion of the fields.
However, opponents of this theory point out that technology does not stand still. For example, innovations in this area allowed the United States to start producing oil and gas from shale, which was previously considered impossible. Thus, we will not produce less oil – it will simply grow in value. Of course, the second variable is demand. The ongoing recession this year raises doubts about the future of black gold: consumers are increasing energy efficiency and can switch to other sources, such as natural gas and various types of renewable energy. In 2012, oil accounted for 31% of global energy consumption. In 1973 – as much as 46%.
Perhaps, over time, the oil will become cheaper simply because it will not be so needed. Advocates of this view recommend selling oil papers. They warn that the inflated cost of energy companies could lead to an economic crisis if fossil fuel prices rise to the point where it becomes unprofitable to pay emission fines for greenhouse gases.
Cloggie on Thu, 11th Jun 2020 3:04 am
Whooptido! The Germans have decided to go full blast for the hydrogen economy! Goal: 4 GW green hydrogen production by 2030:
https://tinyurl.com/yax7s766
After the Dutch mini-Germans did so earlier, now the Germans themselves have put their considerable weight behind the oil-replacement of the future: H2.
Everybody in Europe is now rushing into hydrogen: Norway, Holland, Sweden, Denmark, Portugal, Germany and everybody else.
https://deepresource.wordpress.com/2020/06/11/netherlands-preparing-for-gw-scale-hydrogen-production/
https://deepresource.wordpress.com/2020/05/02/portugal-plans-hydrogen-plant/
https://deepresource.wordpress.com/2020/06/05/nel-hydrogen-announces-350-kw-electrolyser/
https://deepresource.wordpress.com/2020/05/21/joint-venture-itm-linde/
https://deepresource.wordpress.com/2020/05/21/gasunie-itm-realize-1-mw-hydrogen-unit-in-groningen/
https://deepresource.wordpress.com/2020/06/10/hydrogen-storage-facility-for-steel-production/
In a decade or 2, the European hydrogen producers will become serious competitors for the Anglo Seven Sisters.