Peak Oil is You

Donate Bitcoins ;-) or Paypal :-)
Page added on April 6, 2018
Is The Global Oil Market Too Dependent On Prospective Growth In The Permian?

Summary
Anticipated US liquids production growth accounts for almost all projected non-OPEC growth in 2018 and 2019.
Roughly 70% of US production growth will come from the Permian Basin.
This raises the risk of a “black swan” even in the global oil market if productivity or production trends in the Permian unexpectedly deteriorate.
In this article, we will review the latest Drilling Productivity Report (DPR) from the U.S. Energy Information Administration (EIA) for the period covering March 2018. In particular, we will focus on the metrics and trends for the premier shale basin in the U.S., the Permian located in West Texas and Eastern New Mexico, and what this may mean for the US Exploration and Production sector (XOP).
Productivity and production trends in the Permian are crucial in any analysis of not only U.S. production trends and forecasts but also as it pertains to the global supply outlook. As we can see from the chart below taken from the EIA’s Short-Term Energy Outlook publication, production growth from North America will essentially account for almost all of the expected growth in global oil supply in 2018 and 2019.
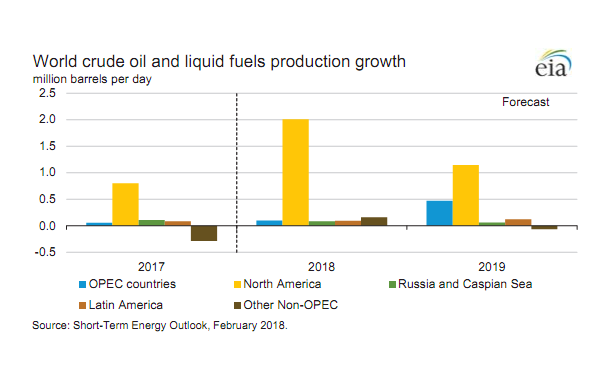
The IEA is estimating production growth of around 0.3mn bpd in Canada in 2018 and a smaller production increase in 2019, while Mexican output is expected to remain flat. As such, the U.S. is expected to account for almost 90% of incremental North American supply growth and probably around 80% of global incremental liquids supply growth.
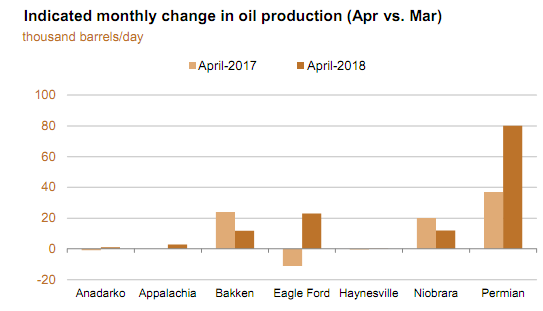
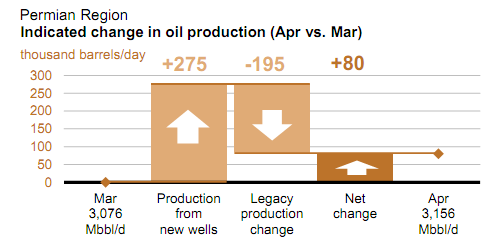
In turn, around 70% of the expected incremental liquids supply growth will come from the Permian basin, at least based on current trends. According to the March DPR report, production in the Permian is increasing at roughly 80,000 bpd, or 67% of total production growth in all of the shale basins* covered in this report.
*The DPR report only covers the various shale basins and so production from legacy conventional (outside of the shale basins), Alaska and the Gulf of Mexico is excluded. However, production from these three sources will remain flat at best, and more than likely decline over the next few years on a net basis, which means we can simply work of the DPR numbers as presented in the table below to get a fairly accurate picture of which basins will account for what proportion of incremental supply growth going forward
So, in essence, the entire global oil market and anticipated supply balance really hinges on what is happening in the Permian. So, let’s take a closer look at the Permian and some of the statistics and trends as provided by the EIA in its monthly DPR report.
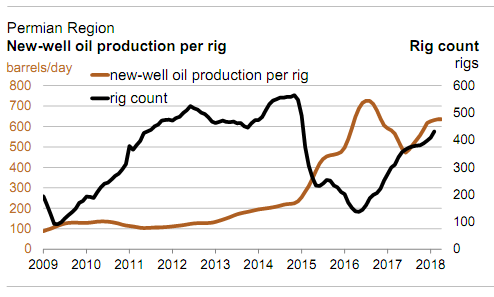
As we can see, productivity in the Permian, although higher than a year ago, is still below its best level recorded in early 2016. Given the sharp rise in drilled but uncompleted (partly explained by logistical bottlenecks) wells or DUCs over the past two years, it may explain why productivity has not increased materially further over the past year. If this is the case, then we would expect productivity or new well oil production per rig to increase steadily as the year unfolds.
However, turning to another metric, the monthly legacy decline reported in the basin, we can see that this metric in the Permian appears to have accelerated quite notably over the past 12 months. As we well know, shale wells have a very high initial decline rate. In many cases, the production output reported by a new well in the first month can decline by 60% in the following 12 months, before flattening out somewhat.
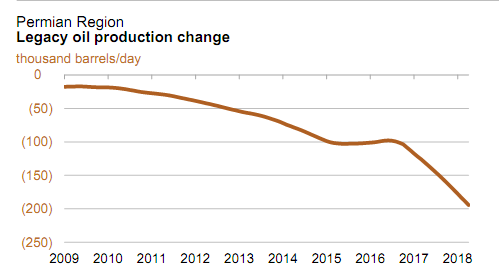
The annualised monthly decline rate is currently at around 2.34mn bpd or 75% of total current production. A year ago, this ratio was just 62%.
Again, we can’t be certain what is driving this dynamic at present. Perhaps it may in part be related to the sharp rise in DUCs over the past 12 months, which are now being brought online. Because most of the loss in the rate of production occurs in the first year of a shale well’s life, a higher proportion of new wells coming online relative to prior years will lead to a relative acceleration in the decline rate, or at least temporarily. Nevertheless, the increase from 75% to 62% is quite striking.
Another reason may be the fact that conventional oil production still accounts for around 1mn bpd in the Permian or roughly a third of total production. The decline rate for conventional oil is much shallower than is the case for shale oil reservoirs. So, the accelerating decline rate observed over the last year may simply be due to the fact that all new wells that are being drilled are shale wells, and as such, the overall legacy decline rate for the basin is simply converging to a decline rate more typical of the average shale well.
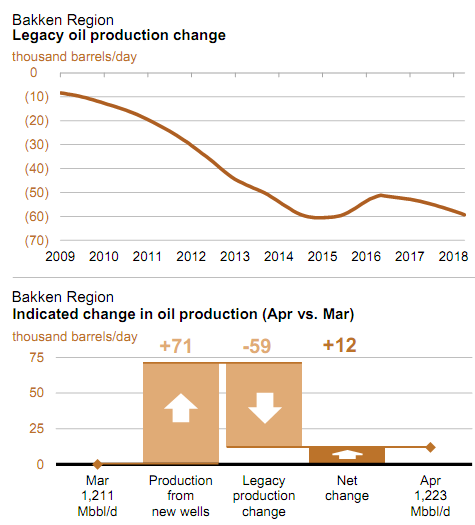
However, it is worth pointing out that the 75% legacy decline ratio to current oil production is still much higher than the Bakken’s legacy decline ratio, which by definition is essentially a pure play shale basin. As we can see below in the data taken from the recent EIA productivity report, the monthly annualised decline rate is roughly 720,000 bpd which equates to 59% of current production, not 75%! So, the Permian’s high decline rate relative to current production would arguably be even higher if it was a “ pure” play shale basin.
As such, we should also be open to the view that the jump in the decline rate could also be related to some of the evolving issues detailed in this recent industry paper, such as well interference (or communication in industry parlance).
In essence, if companies operating in the Permian drill their wells to close to each other, it can negatively impact the anticipated recovery rates and lead to faster-than-anticipated decline rates. The other major issue, somewhat related to well interference, is the basin’s gas to oil ratio (GOR) and associated with that, the basin’s “bubble point”. This discussion can get somewhat technical, and we would direct interested readers to the following article which provides useful additional context.
The key point to understand is that as oil is extracted from a shale well, the pressure in the reservoir it is tapping will fall, and once it falls below a certain point (the bubble point), the natural gas that was initially saturated in the oil will separate from the oil and flow to the surface as a separate product.
As the chart below shows, we can see how, over time, the ratio of gas produced to oil in the Bakken basin (the oldest of the plays) has increased. More importantly, for investors in the Permian, the Bakken is essentially a “ pure” oil play or, in other words, most of the gas produced in the Bakken is associated gas.
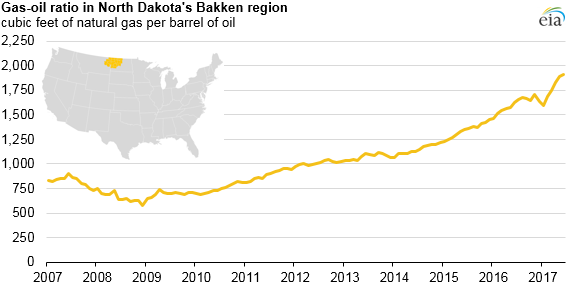
Some commentators often point out that there remain a fair number of legacy wells in the Permian that were drilled primarily to extract natural gas and natural gas liquids. Nevertheless, even accounting for this fact, the difference at a high-level between Permian wet gas production of 10 Bcf/day, which is 5x more than Bakken wet gas production at 2.2 Bcf/day (despite the fact that the Permian only produces 3x more oil), is still quite notable.
So, if the Permian generally exhibits a higher GOR ratio (and therefore likely lower bubble point in that the difference between the basin’s initial reservoir pressure and the bubble point is smaller when compared to the Bakken), is this a negative factor for shale companies operating in the basin?
Well, not necessarily if these assumptions are already factored into the “type curves” and economic models on which production plans and capital expenditure plans are based. Generally speaking, when it comes to the GOR issue, it appears that this factor has been accurately modeled, and even where it has not been accurately modeled, the issue does not appear negative at first glance.
As an example, the incremental gas is usually produced as an incremental by-product in addition to the initial oil estimated to be recovered from a typical reservoir. Therefore, the incremental revenues from the sale of the associated gas can even add to the total product (oil plus natural gas) revenue that is generated by a typical shale well.
Further to this point, recent presentations by one of the largest Permian producers (largest in the Midland sub-section), Pioneer Natural Resources (PXD) detail how despite higher-than-anticipated wet gas output, actual oil production has still met planned oil output estimates.

However, do the shale companies operating in the Permian have sufficient data to model accurately what happens to anticipated production in the latter years of a well’s life? As we can see in the chart below, conventional oil wells (drive mechanisms are still the same in essence or as we understand) also exhibit an accelerating GOR as partial depletion sets in. But, after a while, the reservoir enters advanced depletion when the GOR actually falls once again, but production continues to decline at a similar pace as before.

Although most (more than 50%) of a shale well’s total recoverable reserve is extracted in the first three years, a not insignificant amount is still produced in the latter years of a well’s life, and often, a shale well might still be producing some 8 years after it was first drilled. Typically, the modeled decline rates during this “ sunset” phase are quite shallow, but if a well moves into advanced depletion, one might ask, how shallow?
As the inventory of older wells in the Permian grows, one would think that the overall legacy decline rate of the basin would actually decline as well. This has yet to happen and, in fact, as we have detailed earlier in the article, the legacy decline rate still seems to be accelerating. Further to this, although production from any single well that is older than 3 years is perhaps only 20% of what it produced in its first few months, at an aggregated level, as this inventory of older wells grows, it can still become material in terms of the basin’s overall production. In this case, even a modest deviation from the type curve in these “ latter” years could “move the needle” sufficiently to effect US and by implication global supply forecasts.
The other factor that shale companies cannot model accurately is the issue of well interference, either from wells being drilled to close to each other or the development of a regional pressure sink, which can also lead to unanticipated well communication. As detailed in this article from Wood Mackenzie, so-called “child” wells or wells that are drilled in the same area where some wells have already been drilled in prior years can encounter very different reservoir conditions. This can also lead to steeper declines, lower recoveries, and more than likely, a higher GOR ratio than anticipated as the bubble point of the reservoir is reached quicker than expected.
In fact, if we turn back to the Bakken and looking specifically at production trends over the past 8 years, we do indeed observe some trends that would support the concerns outlined by Wood Mckenzie. According to the website shaleprofile.com (an excellent source of data on shale production trends per basin) and its updated analysis of production trends in North Dakota, the compiler Enno Peters noted the following –
“As I remarked last time as well, it’s interesting to note here that initial well performance has been steadily improving over the past 10 years, but this has come at least somewhat at the expense of later well performance as some of the more recent vintages are now on a path to cross the curves from earlier years. For example, the average 2013 well is now tracking a lower recovery than the average 2008 well, despite starting better.
Significantly more gas is produced though, as can be seen when you switch ‘product’ to ‘gas’, and also in the 9th dashboard (‘Gas Oil ratio’): newer wells start gassier, and the GOR rises more quickly”
The above comments appear to support the view that production in the latter years of a shale wells life may underperform due to the reservoir’s bubble point having been reached. It is also interesting to note that newer wells are now gassier than in the past. We do not know if this is due to growing well interference (as available acreage is fully exploited) and/or low-grading (in other words producers now being forced to drill outside of the basin’s core or most prolific acreage).
If any of the above factors proves to be the real reason for the recent increase in the Permian’s legacy decline rate, it may suggest that the higher ratio (legacy decline as a % of current production) is here to stay. That in turn would imply that many more wells would need to be drilled in order to continue growing production in the Permian at the rate that is presently anticipated. If not, based on the current ratio and, assuming the rig count (therefore number of wells being drilled per time period) remains static, total oil production in the Permian could top out within 12 months and at a figure below 4mn bpd.
Such a development would certainly upend the current optimistic forecasts for US production growth over the next few years and throw a wrench in the global supply balance. We could call this outcome the Permian “tail-risk”. Naturally, the shale companies operating in the basin could just choose to employ more rigs and drill more wells in order to keep overall production growing.
This would more than likely be the case, if individual well economics, despite the issues discussed above, have not materially changed. This appears to be the case in the Bakken where despite the rise in the basin’s GOR over the past five years, individual well economics have not materially changed, while, as previously noted, the basin’s legacy decline rate has remained fairly steady as well. In fact, technical productivity enhancements have still led to an overall improvement in productivity and therefore lower breakevens compared to just a few years ago.
However, this would be a boon for oil service companies as it would imply even more work for them. By our rough calculations (which may be incorrect), in order for Permian production to grow by a further 1mn bpd in 2019 (assuming the current high legacy decline rate persists), the rig count in the Permian may have to increase by as much 100 rigs.
So, perhaps one possible way for investors in shale companies mainly focused on the Permian to diversify their risk somewhat would be to allocate some of their capital to oil service companies and, in particular, those with a material exposure to the US onshore land market.
However, what if these issues do end up becoming sufficiently material in order to change the individual well economics in the Permian going forward? Well, naturally, it would imply not only would companies operating in the Permian need to drill more wells per time period in order to sustain or grow production to meet current industry forecasts but the breakeven price per barrel of oil could increase.
Although these issues do not seem to be material in terms of production and individual well economics in the Bakken, it is clear that the Permian may be a different “kettle of fish”. As noted, the Permian appears to generally exhibit a higher GOR and, at this juncture, a much higher legacy decline rate. So, although these issues have not turned out to be material in the Bakken, they may yet prove material in the Permian.
Such a development could end up making other oil producing shale basins (such as the Bakken and the Eagle Ford) relatively more attractive as well as oil production from non-shale sources which have effectively been left for dead such as offshore and the Canadian oil sands. So, in addition to allocating capital to the oil services sector, the ultimate hedge for a Permian “tail risk” event may to be to also allocate some capital to the Canadian oil sands and offshore oil sectors.
Nevertheless, on a final note, we would point out the trend of large Permian players divesting their acreage in other shale basins seems to be continuing. Both PXD and QEP Resources (QEP), primarily focused on the Permian, are looking to sell their acreage in the Eagle Ford (PXD) and the Bakken (NYSE:QEP), respectively. This type of corporate action suggests that company insiders with arguably the best geological information on the Permian are not concerned about the basin’s future prospects and therefore neither should investors, or at least in theory.
33 Comments on "Is The Global Oil Market Too Dependent On Prospective Growth In The Permian?"
Davy on Fri, 6th Apr 2018 6:05 am
I am not the oil expert here but I will remind even the experts that this type of oil is “economic” oil. Economics play a big role in its production. It is price and economy sensitive much more than conventional. It requires refinery activity that is more involved than conventional oil. With that in mind we must remember that an economy that is hit hard by a downturn will not be growing the production of this type of oil. Many will say that is common knowledge but what is ignored is the tendency of our techno optimistic society to see an average sustained growth rate as a basis of their decisions IOW they make predictions and almost never consider a down business cycle. It is almost as if that is another issue or subject but when you have economic oil it is a significant concern that should not be ignored. This points to almost everything commented on today in regards to the future by academia and MSM. We always have the economic situation as a constant. It is like Economist do with energy in their calculations. Economist are not concerned with energy as such because of substitution and innovation. Someday the business cycle will cycle and maybe hard then all these rosy predictions were just dust in the wind.
Davy on Fri, 6th Apr 2018 6:31 am
“Stocks Tumble As China Urges EU To Join Fight Against US Protectionism”
https://tinyurl.com/y8cvfmsf
“As Petromatrix managing director Olivier Jakob wrote in a recent reports, if the trade war between U.S. and China continues “there is a risk for oil prices that China uses the bazooka option it has on U.S. crude oil exports,” which would be to curb shipments from America. China is one of the biggest importers of U.S. crude at ~400k b/d, so any counter-tariffs on crude could become very heavy for the U.S. supply and demand picture, and would weigh on U.S. prices and spill over to global oil pricing. Jakob concluded that the market needs to start balancing downward price risk of trade-war escalations with upside risk of Iran sanctions as oil flows could be about the same.”
JuanP on Fri, 6th Apr 2018 9:26 am
It will be interesting to watch this play out. Most of the world has peaked. There are but a handful of countries capable of increasing their oil production at current prices. The USA’s shale is playing a bigger role than I originally thought it would. I am very curious about what will happen when the US shale boom ends. A few more mbpd form the last stragglers may still be there for a last call. Time to drive across the country one last time!
This is the biggest show on Earth and most people don’t know it’s playing! We are going down, down, down!
Boat on Fri, 6th Apr 2018 9:43 am
Davy
The heavy sour crude imported around the world takes a lot more refining than light oil. That’s why heavy oil is cheaper than most light oil.
Mixing the oils to get to 32 api had to happen even before fracking took off.
Boat on Fri, 6th Apr 2018 9:57 am
JuanP
As long as OPEC/Russia colludes to keep oil prices high, Frackers will be funded. Frackers were adding drilling rigs at $40. At $60 they are running out of sand, pipeline capacity, trucks and trained manpower.
At $80 fracking will have the funds to go world wide. Shortages bring on high price. High prices pay for the infrastructure to bring on more oil.
This is not shortonoils world. This the real world.
rockman on Fri, 6th Apr 2018 10:05 am
Just a minor reminder: “Again, we can’t be certain what is driving this dynamic at present. Perhaps it may in part be related to the sharp rise in DUCs over the past 12 months.” All wells become a DUC for part of there life. When a rig finishes drilling it is removed from the rig count. At that point every well enters the completion phase between drilling and producing…IOW a DUC. Even when the company moves in as quickly as possible to complete a hz well it can easily take a month. And sometimes several months. But even once frac’d and ready to produce it can take a month or 2 to install the production infrastructure. And even after production begins it can take a month or 2 before the new producing well is reported to the regulatory agency. And then perhaps another month or 2 before that agency releases the data to the public.
Bottom line: between the end of drilling and the release of public info showing a well is no longer a DUC the time gap can be 6 to 12 months. And even longer if frac crews become in short supply as the dii during the initial frac’ng boom. Time lags in the oil patch are easily unappreciated by those not familiar with the details of the dynamic.
Boat on Fri, 6th Apr 2018 10:15 am
Rock
The dynamic has been going on for years and the duct count above normal in the thousands. Every month expect another 150 or so to be added to the tally.
With the oil take away in the Permain set to fill look for those ducts to sit. It’s our new SPR.
BobInget on Fri, 6th Apr 2018 11:04 am
IEA Shocking Demand Increase! 2.4 Million bpd from Q1 to Q4 2018
I haven’t look at the yearly demand curve for quite some time, and the change in shape of the curve shocked me. In the past Q2 was the low point of the year, and was the shoulder season. All that has changed when Inlooked at the IEA estimates for 2018 from March report.
Q1 2018 demand is estimated to be 98 Mbpd
Q2 demand jumps by 1 MILLION a day!
Q3 jumps another 700 kbpd!
Q4 adds another 700 kbpd
From Q1 to Q4 demand jumps by 2.4 MILLION per day.
What I found interesting is that Middle East demand from Q1 to Q2 increased by 700kbod.
Anonymous on Fri, 6th Apr 2018 11:25 am
It’s a pleasantly written article and has some data, but I have some issues with it.
1. Base decline is better discussed in the Rystad presentation. Yes, it is increasing but so what, volume grows on top of it. Just like the last boom. Also, you shouldn’t annualize decline rates (they change month 1 to month 12).
2. The gas oil ratio stuff is an old kerflutter and didn’t really get traction. Most of it came from a LinkedIn blog by an out of work geologist. And he cherry picked his well views (not the average perspective). It is true though that gas infrastructure is needed. But there is no evidence to date that loss of gas drive is any different than the expected bubble point behavior and loss of drive (that happens with all wells).
3. If you want to speculate that the wells are getting worse, just look at shaleprofile.com. They are actually getting better. And God knows, the peakers would be screaming from the trees if the 2015/16/17 well profiles were reversed.
4. Ignores one other major concern: water disposal. Lot more produced water in the Permian than Bakken or STACK. Will strain the basin in infrastructure and is a cost just in lifting.
5. It’s no “aha” that World growth is dependent on the US and more specifically the Permian. The aha is look how well it is growing there…Peak Oilers like David Hughes didn’t even have it on the radar a few years ago!
jawagord on Fri, 6th Apr 2018 11:49 am
There will always be a market for less conventional oils if the selling price is right. The blended API of oil input varies from refinery to refinery. From EIA data for the US:
New Mexico and Texas Inland refineries average API is over 39.
PADD 5 area refineries average 28
USA overall average is 31-32
So depending on the price of the crude US refineries overall can take (or will retool to take) a wide range of oil grades to blend to make the optimum financial return. In the past decades some US refineries have retooled to accept heavier crudes, maybe going forward some will retool to accept larger volumes of light oil if the price is right.
https://www.eia.gov/dnav/pet/pet_pnp_crq_dcu_r2a_a.htm
Outcast_Searcher on Fri, 6th Apr 2018 12:22 pm
And let’s pretend that globally, other highly productive shale formations can’t be found and exploited at the right price, even as the overall technology continues to improve.
Given that the world is a big place and that there are various environmental/political reasons the US is currently so dominant in shale oil fracking production, over the next 10 to 20 years, the “black swan” events are more likely to be much more overall oil fracking production than currently forecast.
And that would be consistent with the long term trend re overall crude oil production as technology improves — which the short term peakers/doomers seem unwilling or unable to grasp (or at least admit).
Anonymous on Fri, 6th Apr 2018 12:42 pm
Rock:
Agreed on the DUCs. Some delay and backlog is normal.
Rystad had some nice analysis on this. The % of long-dated DUCs (they pick 7 months as an arbitrary number) is growing. However, this is normal. It was a high percentage in 2014 also. It was less extreme in 2016, but that just had to do with the slowdown. Basically if the activity level goes up, DUC backlog amount and even average DUC age goes up. The reverse when there is a bust. Right now the Permian is in boom.
Dredd on Fri, 6th Apr 2018 1:20 pm
The largest desert on Earth is melting (Antarctica’s Glaciers by Ocean Area and WOD Zone – 3).
It is melting into water.
Anonymous on Fri, 6th Apr 2018 2:26 pm
jawa:
I think pipeline constraints is the bigger issue than API mismatch. They just can’t get the stuff out right now. Differential has moved up enough to enable rail/truck shipping (but those are in short supply also!)
The funny thing is the price is still high enough (mid 50s) to incentivize production. Will be interesting to watch and see if the Texans figure out how to (quickly) transport more product or differentials explode to Canadian tar sand differentials. [My bet is the Texans figure it out. It is still America down there…good can do spirit.]
rockman on Fri, 6th Apr 2018 3:59 pm
Boat – “The dynamic has been going on for years and the duct count above normal in the thousands.” What is the “normal” DUC count? IOW the number of DUC’s is a function of how many new wells are being drilled since every new well is counted as a DUC for some period of time. IOW the DUC count increases as the rig count increases/decreases. Thus the DUC count can be no more “normal” then the rig count.
A – Good point about that stat…if it’s correct. But to be correctly calculated one needs to know (A) when every well finished drilling and (B) when that well began producing. (B) is readily available IF one pulls up the month of first production. In Texas one has to pull up the individual production data for each well drilled here. Certainly possible but takes a bit of time. OTOH there’s no expedient way of knowing when each well finished drilling.
Again not impossible but before I take anyone’s word on their number I would like to see their data base. Not difficult for the author to post: A simple Excel spreadsheet with each well’s API #, spud date, finish drilling date and month of first production. Would take no effort for an author to post such data with his DUC data since he has to collect all this data to present his stat.
Have you seen anyone include such support data with their claim? Not saying no one has done this, just saying I’ve yet to see it despite seeing many, many articles claiming they know how long wells have fallen into the DUC category and for how long. As I just posted to Boat the number of DUC’s should have been increasing as the number of hz shale wells have been drilled. But that does not automatically mean wells are spending longer periods as DUC’s. In fact I would bet you lunch that the time wells drilled today spend as DUC’s is less then right before the oil price collapse: less demand for frac crews today then when activity was much higher. Also as laterals are drilled longer (and new production per well is higher) the less demand for frac crews. It essentially doesn’t take much longer to frac an 8,000′ lateral with 34 stages then it does to frac a 3,000′ with 12 stages. The lengthy part of the operation is setting all the equipment up. Pretty much the same amount of time regardless of the frac length.
Anonymous on Fri, 6th Apr 2018 4:36 pm
Rockman: the data is out there and even easier the analysis of the data is out there. The problem is this site, the people just fight with each other rather than reading and learning. It is knee jerk city. The funny thing is it is not even peakers versus cornies but peakers chewing on peakers!
MASTERMIND on Fri, 6th Apr 2018 6:16 pm
Peak oil is not a myth -The Royal Society of Chemistry
Once conventional oil’s rate of loss exceeds unconventional oil’s rate of production, world production must peak. Production of sweet, light crude actually peaked in 2005 but this has been masked by the increase in unconventional oil production, and also by lumping together different kinds of material with oil and referring to the collective as ‘liquids’. (More recently, the term ‘liquids’ is often upgraded to ‘oil’, which is highly disinformative since the properties of the other liquids are quite different from crude oil.)
https://www.chemistryworld.com/opinion/peak-oil-is-not-a-myth/7102.article
MASTERMIND on Fri, 6th Apr 2018 6:17 pm
The Collapse of Civilization Manifesto
MASTERMIND on Fri, 6th Apr 2018 6:17 pm
https://imgur.com/a/pYxKa
Boat on Fri, 6th Apr 2018 6:23 pm
Rock
All the duct information is supplied every month by the eia. An Excel spreadsheet shows the number of wells drilled and the number completed. Find the Drilling Productivity Report. On the right side of the page there is a link for the DUCT data.
twocats on Fri, 6th Apr 2018 7:36 pm
the peakers have to fight among themselves to drown out the sound of the oil-lube circle-jerk that goes on between most of the commentators on this sight, or the electricity-to-the testicles renewable-energy cheerleaders.
peakers see nothing but “party on” out there in the “real world” so they come to peakoil.com and other similar sights to acknowledge and follow the (not so hidden anymore) reality of collapse.
Most of the commentators here are so full of it I’m starting to think Mastermind is on to something.
Plantagenet on Fri, 6th Apr 2018 8:01 pm
Of course the oil markets are too dependent on continued production growth in the Permian. But what choice do they have? Most of the recent growth in global oil supplies is coming from the US, and most of the growth within the US right now is coming from the Permian.
Cheers!
MASTERMIND on Fri, 6th Apr 2018 8:53 pm
Two cats
So true..Ever since I came along! I have changed the game forever
GregT on Fri, 6th Apr 2018 10:00 pm
“Ever since I came along! I have changed the game forever”
People have been aware of the game since long before you were even born MM.
makati1 on Fri, 6th Apr 2018 10:31 pm
twocats, MM is on something, not onto something. lol
BTW: we passed peak affordable oil. What is left is not important, except to the fools still invested in a dying system.
MASTERMIND on Fri, 6th Apr 2018 10:58 pm
I just let go. Lost in oblivion. Dark and silent and complete. I found freedom. Losing all hope was freedom.
Chuck Palahniak
Fight Club
MASTERMIND on Fri, 6th Apr 2018 11:19 pm
Lawmaker Cites Satirical Article To Argue Against Legalizing Cannabis
The article jokes about the deadly consequences of legalization in Colorado.
It reads, “Colorado is reconsidering its decision to legalise recreational pot following the deaths of dozens due to marijuana overdoses.”
The article goes so far as to quote a fictional doctor: ” ‘It’s complete chaos here,’ says Dr. Jack Shepard, chief of surgery at St. Luke’s Medical Center in Denver, ‘I’ve put five college students in body bags since breakfast and more are arriving every minute.’ ”
https://hightimes.com/news/lawmaker-cites-satirical-article-argue-against-legalizing-cannabis/
Boomers are idiots!
MASTERMIND on Fri, 6th Apr 2018 11:39 pm
Government Intervention is triggered by a Keynesian belief that aggregate demand can be increased by lower interest rates and by increasing government deficits thereby somehow spurring economic growth. Debt grows faster than income growth and eventually has to be restructured, i.e., everyone loses in the end. Since 2007, global debt has grown by US$57 trillion and it’s had disastrous results. Greece, Detroit, Puerto Richo, Venezuela are just the beginning of this trend. Soon, it will be followed by larger countries like China and United States.
https://www.perchingtree.com/return-of-great-depression/
GregT on Fri, 6th Apr 2018 11:49 pm
Palahniak wrote Fight Club with the intentions of being disturbing MM, and the quote that you linked above describes clinical depression to a T.
GregT on Fri, 6th Apr 2018 11:56 pm
“Boomers are idiots!”
I guess that means that there are no boomers in Canada then, right MM? Marijuana will likely be legalized this summer.
Perhaps only American boomers are idiots/
GregT on Fri, 6th Apr 2018 11:57 pm
“Government Intervention is triggered by a Keynesian belief that aggregate demand……….”
The modern school of eCONomics is a failed ideology.
David on Sat, 7th Apr 2018 6:26 am
“The modern school of eCONomics is a failed ideology.”
Translation: I don’t understand economics as it relevance to us currently so I call it an ideology and failed. This is something people that lack intelligence do.
twocats on Sat, 7th Apr 2018 7:19 am
but gregt isn’t that the point? the whole US populace is medicated to their eyeballs. a certain percentage is fight club and they have a tendency to embrace their madness. But there’s little escaping the horror no matter what route you take. a slight parallax tilt of the head and its demons as far as the eye can see.