
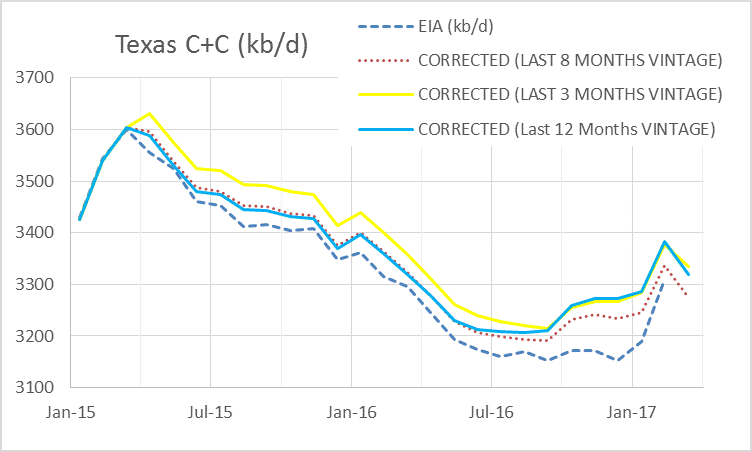
The Chart above compares several different combinations of past (vintage) data to estimate output. The dotted line is based on the most recent 8 months (August 2016 to March 2017) of data saved from the RRC website, the blue solid line is based on the past 12 months of data, and the yellow line is based on the most recent 3 months of data.
Each estimate uses the most recent 24 months of data from each month. A significant change in the size of the correction factors began in August 2016, which is the basis of the 8 month Corrected estimate. Dean Fantazzini prefers a 3 month estimate and an estimate using all vintage data (see chart below), I show the 3 month and 12 month estimates for comparison to the 8 month estimate, I expect the final data will be somewhere in the range of the 3 month to 12 month estimate (or between 3 month and 8 month estimate from June 2016 to March 2017).
The annual rate of increase in Texas C+C output from Sept 2016 to March 2017 was 250 kb/d per year and average annual 2016 output was 3269 kb/d, if the linear trend continues through Dec 2017, then average annual Texas C+C output would be 3420 kb/d in 2017, about 150 kb/d higher than 2016. The increased rig count will likely lead to a larger increase in output, possibly 300 kb/d.
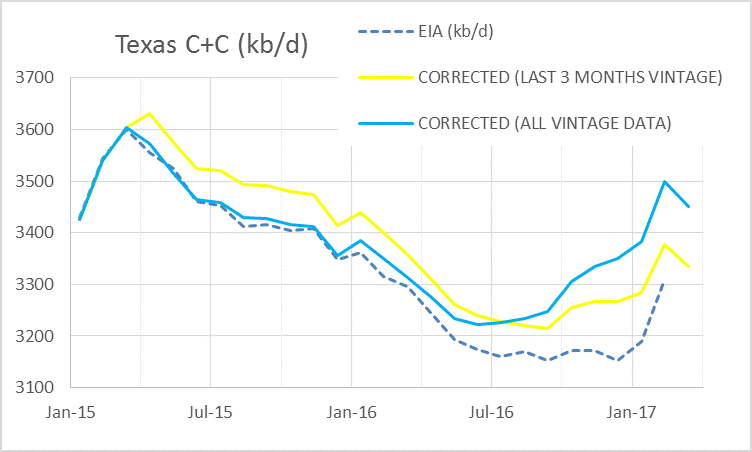
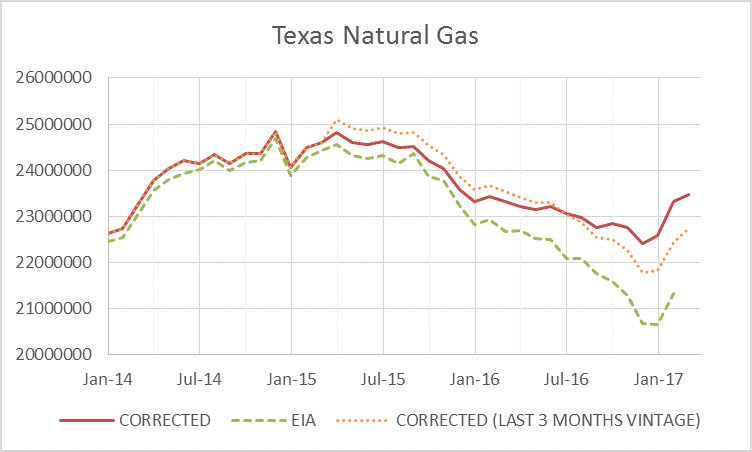
Dean Fantazzini’s estimate for Texas C+C, the natural gas estimate follows.
Using the 12 month Corrected estimate combined with Texas railroad commission data for the Permian Basin (Districts 7C, 8 and, 8A) and statewide crude plus condensate(C+C) output to find the percentage of Texas C+C produced in the Permian basin, I multiply the percentage by the corrected 12 month Texas estimate to find an estimate of Permian Basin C+C output.
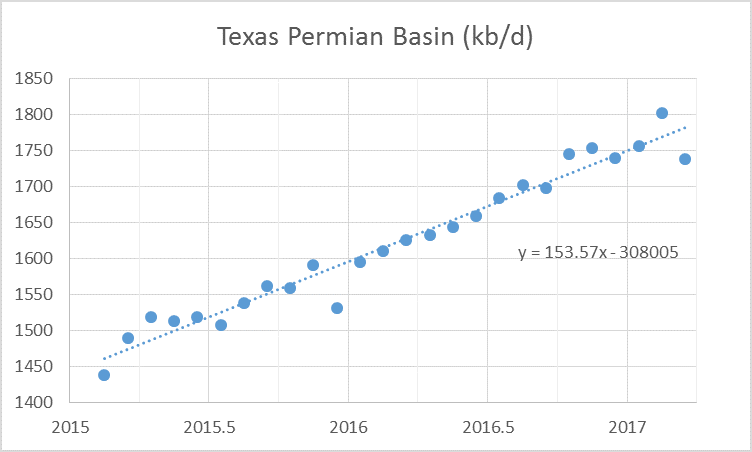
From February 2015 to March 2017, the linear trend for Permian basin output has been an annual rate increase of about 154 kb/d each year, the rising rig count may result in a faster rate of increase in the second half of the year. A similar estimate was done for the Eagle Ford region (Districts 1-5), note that both these estimates include output from vertical wells and conventional reservoirs that may not be included in other estimates (such as the EIA’s tight oil estimate and the estimates at shaleprofile.com).
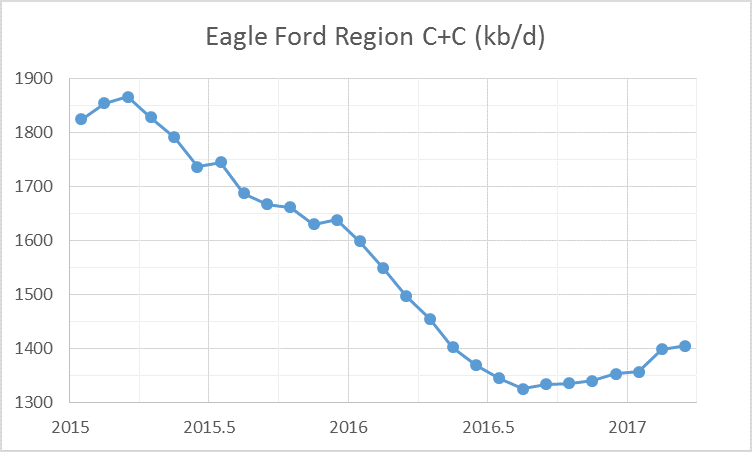
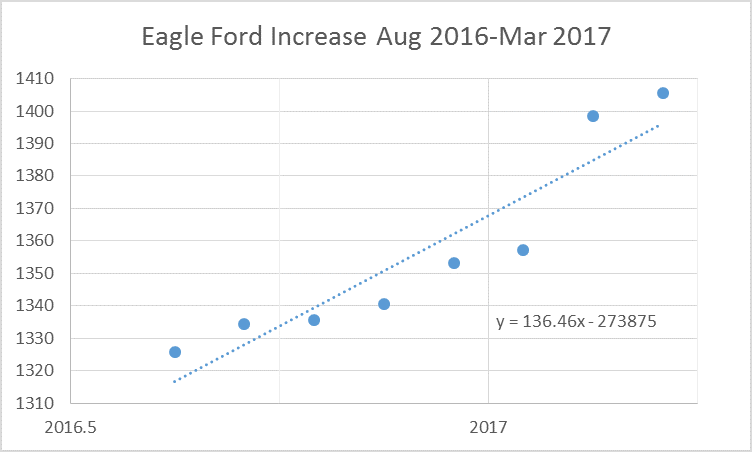
Eagle Ford output dropped sharply from 1866 kb/d in March 2015 to 1326 kb/d in August 2016, a drop of 640 kb/d in 17 months (an annual decline rate of about 450 kb/d per year), since that time there has been a gradual increase at a rate of 136 kb/d per year.
Average Eagle Ford C+C output was 1409 kb/d in 2016, if the annual rate of increase continues at 136 kb/d for all of 2017, then the average for 2017 would be 1430 kb/d, or nearly flat from 2016 to 2017.
The annual increase in average C+C output for the Texas Permian and Eagle Ford combined from 2016 to 2017 is likely to be between 200 kb/d and 500 kb/d with a best guess of 350 kb/d. Including the New Mexico Permian basin in the estimate would increase the best guess of the 2016 to 2017 average annual increase to 400 kb.
rockman on Tue, 23rd May 2017 2:49 pm
Dennis, Dennis, Dennis – You had to do it, didn’t, you? So many are already jealous enough of our state you just had to give them one more reason: our increasing wealth from improved oil/NG. Just when things were looking up after shipping Perry out of the state to DC. LOL.
SRSroccoReport on Tue, 23rd May 2017 3:39 pm
Improved oil/NG…. LOL. Rockman, you got to be kidding, right?
I give TE-HAUS about 5 more years and oil production will be heading lower by a serious rate.
steve
rockman on Tue, 23rd May 2017 6:05 pm
“Improved oil/NG…. LOL. Rockman, you got to be kidding, right?” Kidding about what? You mean the oil production rate in Texas in 1Q 2017 being about twice what it was in 1Q 2011? And NG producing about the same today as it was in 2011? Maybe you mean the oil/NG taxes paid to the state ($2.28 BILLION) in 2016 that increased 2.2% from 2015? We could go back 10 years to 2006 when Texas was producing 392 million bbls of oil compared 1.18 BILLION bbls of oil in 2016. Or maybe you mean the 4.9 trillion cuft of NG Texas produced in 2006 compared to the 7 trillion cuft produced in 2016?
Sorry, I just don’t get the joke. How exactly is the Texas petroleum industry, the state tax collector and our royalty rich land owners not doing pretty f*cking good these day? LOL. Could you offer some FACTS to explain? I’m sure everyone here is anxiously awaiting a good laugh. LOL.
Anonymous on Tue, 23rd May 2017 7:20 pm
EOG and Carlyle will be doing a JV in the Granite Wash (OK county, but next to Texas, mostly a TX play).
By the way, this is an example of private money drilling. Not the only one.
http://www.carlyle.com/media-room/news-release-archive/carlyle-and-eog-resources-announce-400-million-drilling-partnership
rockman on Tue, 23rd May 2017 10:15 pm
Yes, much of the drilling boom was funded by “mezzanine banks such: “Carlyle Energy Mezzanine Opportunities Fund II L.P. will fund up to $400 million for the development program over four years.”
But they are banks but very sophisticated investment organizations. And a much more cutthroat group then the bankers. LOL. They utilize techniques that can lead to a company giving them 20% – 25% of the profit. No, not a 20 to 25 percent interest but that much of the asset value. And they usually collect much or all of it before the operator gets a single $. And typically they have control over the cash flow and dictate how much of it the operator can spend.
So why would a an operator put up with that crap? Because they don’t have a choice: you go hat in hand to a mezzanine source when the risk is beyond that which a real bank would take with a loan. Which is also why mezzanines have some of the sharpest hands in the business. And why they often get a piece of the action: screw up and you make nothing…get it right and you could end up with a $500,000+ bonus next Christmas.
Yes: the Rockman has dealt with mezzanine “bankers”. And you might have to smile when you take a bite of that sh*t sandwich they serve up. And buy them a nice steak lunch. OTOH you got your capex when you couldn’t get it anywhere else. LOL.
makati1 on Wed, 24th May 2017 3:35 am
In other news: If you want to know how the United States of America became the Fascist States of America, watch this 8 year old video.
https://www.youtube.com/watch?v=hTbvoiTJKIs
Or listen to it while you prep for the collapse.
deadlykillerbeaz on Wed, 24th May 2017 8:09 am
http://www.rrc.state.tx.us/oil-gas/research-and-statistics/production-data/historical-production-data/crude-oil-production-and-well-counts-since-1935/
Texas oil wells produce 15 bpd average.
You need a lot of them to produce 2,6000,000 bpd.
178,927 oil wells is the number of wells to produce 2,600,000 bpd.
You’ll need a fair sized workforce to do that, jobs, the oil doesn’t just jump into the tanks.
rockman on Wed, 24th May 2017 9:07 am
killer – Actually not as many hands are needed to keep EXISTING wells producing as some folks think. In many cases a single “gauger” will monitor a field on a daily basis. Checks for oil levels in the tanks, notes pressures and keeps an eye out for leaks and such. Typically gets paid by the well: $75 – $125 per well per month. Obviously has to gauge a fair number of wells every month to make a decent income.
Another way to look at the total LOE, Lease Operating Expense, which would include labor. Obviously for an average well making 15 bopd (IOW half of those 170,000 wells makes a lot less then 15 bopd) the cost per bbl has to be father low. Less the $3 per bbl is not uncommon. If it weren’t such a low expense we wouldn’t still have as many strippers. Remember Texas was still producing as many wells when oil was less the $35/bbl before the drilling boom.
Dennis Coyne on Wed, 24th May 2017 3:10 pm
Hi Rockman,
Do you have an opinion in the USGS estimates on the Wolfcamp and Spraberry LTO plays.
Supposedly their best estimate (F50) is about 23 billion barrels of undiscovered oil. Add about 3.1 Gb of proved reserves (LTO estimate) and about 3 Gb of cumulative LTO output and that would be 29 Gb of oil.
My guess is that we will reach peak demand by 2040 and about half this oil will never be economically recoverable as oil prices will eventually fall back to today’s level or less (in 2016$) by 2040 or perhaps sooner.
I expect oil prices will peak between 2025 and 2030 at around $120/b (2016$) and then gradually decline as people gradually move to alternative means of transport.
Anonymous on Wed, 24th May 2017 4:52 pm
Just because you give a loan doesn’t make you a “bank”. Carlyle is a private equity company. Mez financing is a PE activity. Not that what you call it really makes a difference. Just how much money you get and the terms.
There is private money in the shale patch. Comments that only public companies are drilling are mistaken.
EOG has choices. They are the class of the shale operating companies. They did the deal because it was worth it to them to get the CAPEX. Both Carlyle and EOG are sophisticated entities. EOG like the terms and Carlyle liked the operator.
Anonymous on Wed, 24th May 2017 4:58 pm
1. Rockman, how about answering the question based on strip oil as well (not just Dennis’s $120). Oil averaging 50-55 over the next 10 years.
2. I am also interested in Rockdoc’s views.
3. FWIW from me: USGS seems to have been underestimating shale (and raising estimates over the years to correct). I suspect the issue is much more with gas than with oil though. And with both TRR does not mean economic production. But the increases in learning probably offset the issue. So you are at a wash on oil. Probably still under with gas (where we keep getting better and better at releasing it and where it just flows so much better out of shale than oil does).
Dennis Coyne on Thu, 25th May 2017 8:46 am
Hi Anonymous,
The futures strip usually is only good for the next 6 months as a predictor of future prices (and does not usually get it right).
In any case lower prices implies a lower ERR (economically recoverable resource). If prices remain low ($55/b or less long term) the ERR will be close to the F95 USGS estimates and for US LTO will be on the order of 25 to 30 Gb, a drop in the bucket for a World URR of 3000 to 4000 Gb of C+C.
Anonymous on Thu, 25th May 2017 8:55 pm
I wanted Rock’s estimate off of the strip. No duh that we have less reserve at a lower price. This is an obvious concept and Rock has said it himself several times.