Peak Oil is You

Donate Bitcoins ;-) or Paypal :-)
Page added on March 9, 2017
Bakken January Production Data

North Dakota has published January production data for the Bakken and for all North Dakota.
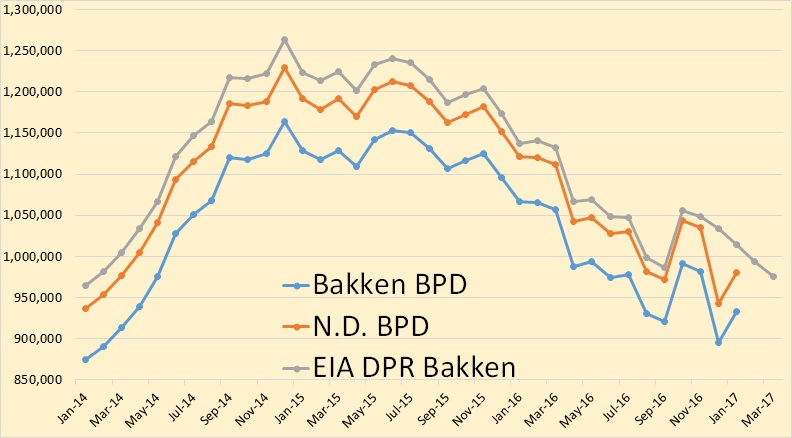
Bakken production was up 37,617 bpd to 932,817 bpd while all North Dakota’s production was up 37,972 to 980,294 bpd.
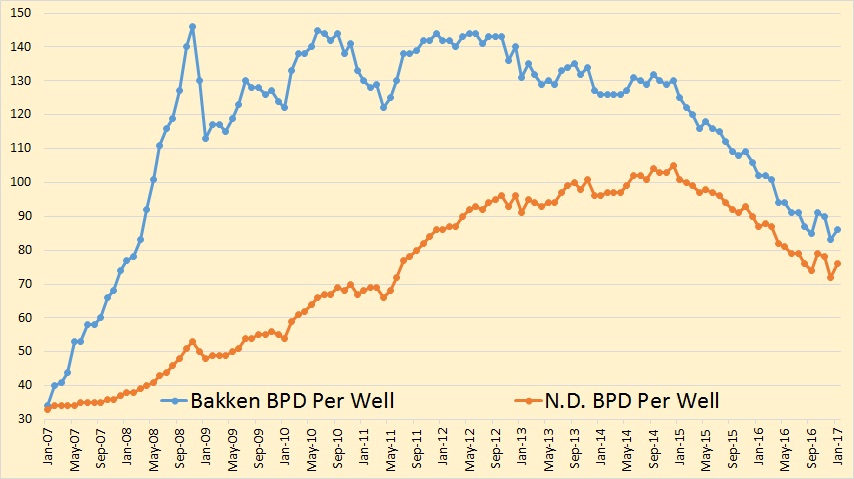
Bakken bpd per well was up 3 to 86 while the average bpd per well for all North Dakota wells was up 4 to 76.
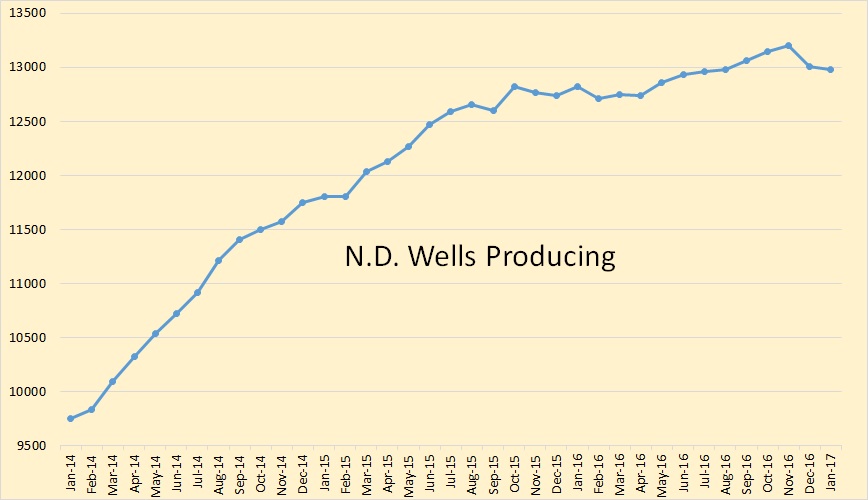
The North Dakota stats have “Wells Producing” dropping by 189 in December and dropping another 35 in January for a total decline of 224 over the two months. The total number of producing wells in North Dakota in January stood at 12,976.
You will notice these numbers differ quite a bit from Lynn Helms’ numbers below. I have no explanation for this.
From the Director’s Cut:
Oil Production
December 29,211,993 barrels = 942,322 barrels/day
January 30,389,117 barrels = 980,294 barrels/day(preliminary)
(all-time high was Dec 2014 at 1,227,483 barrels/day)
Producing Wells
December 13,337
January 13,333 (preliminary)
(all-time high was Nov 2016 at 13,520)
Permitting
December 35 drilling and 0 seismic
January 81 drilling and 1 seismic
February 45 drilling and 1 seismic
(all time high was 370 in 10/2012)
ND Sweet Crude Price
December $39.93/barrel
January $40.51/barrel
February $42.74/barrel
Today $41.50/barrel
(all-time high was $136.29 7/3/2008)
Rig Count
December 40
January 38
February 39
Today’s rig count is 44
(all-time high was 218 on 5/29/2012)
Comments:
The drilling rig count decreased two from December to January, then increased one from January to February, and is currently up 5 from February to today. Operators are shifting from running the minimum number of rigs to incremental increases throughout 2017, as long as oil prices remain between $50/barrel and $60/barrel WTI.
The number of well completions decreased significantly from 84(final) in December to 54 (preliminary) in January.
Oil price weakness is anticipated to last into the second quarter of 2017.
There were two significant precipitation events, five days with wind speeds in excess of 35 mph (too high for completion work), and eleven days with temperatures below -10F. The first half of January was as bad as December 2016, but the last ten days of the month the weather was dry, warm, and a little windy.
More than 98% of drilling now targets the Bakken and Three Forks formations.
Estimated wells waiting on completion is 802, down 5 from the end of December to the end of January. Estimated inactive well count is 1,678, up 105 from the end of December to the end of January.
Okay, but what is the rest of the USA doing as far as oil production goes. The data below is from the Petroleum Supply Monthly and goes through December 2016, not January as the above North Dakota data does. The data is in thousand barrels per day.
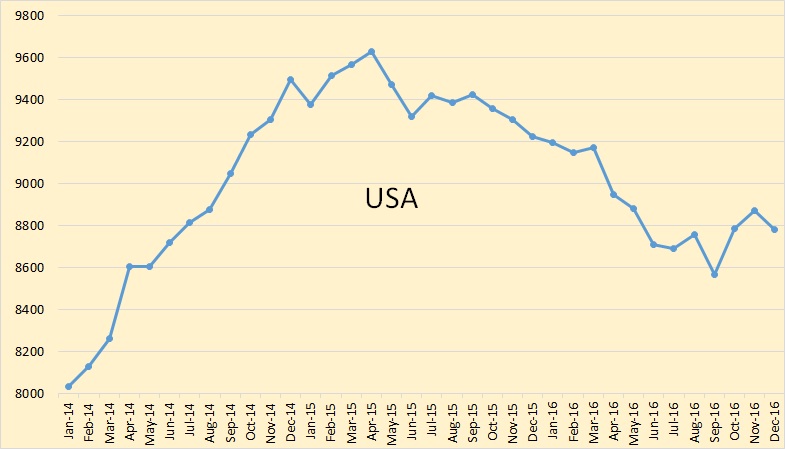
US C+C production was down 91,000 bpd in December. Most of this drop was from North Dakota which they have down 89,000 bpd in December.
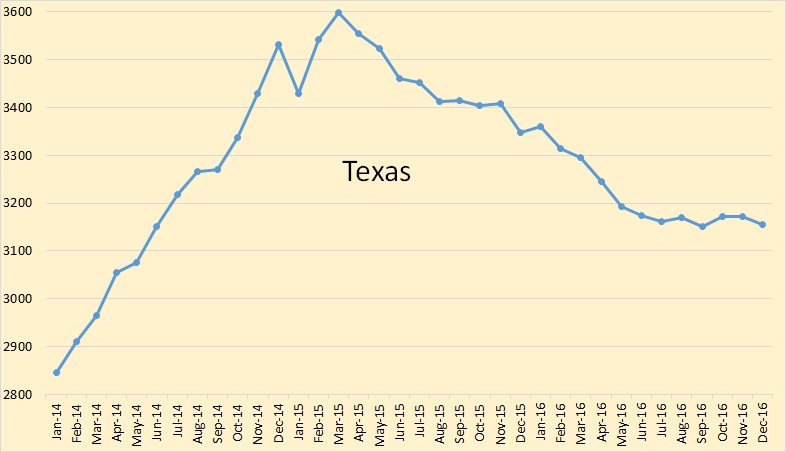
The EIA has Texas down 17,000 bpd in December. Notice that they have Texas virtually flat for the second half of 2016.
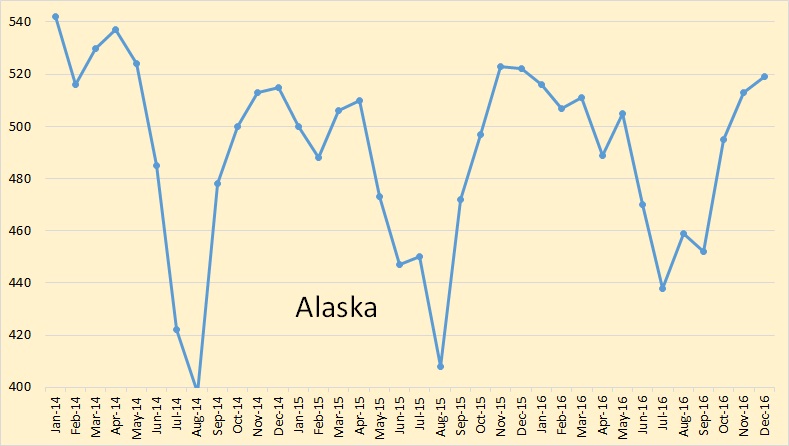
Alaska has stopped their decline, temporarily anyway. Alaska was up 6,000 bpd in December.
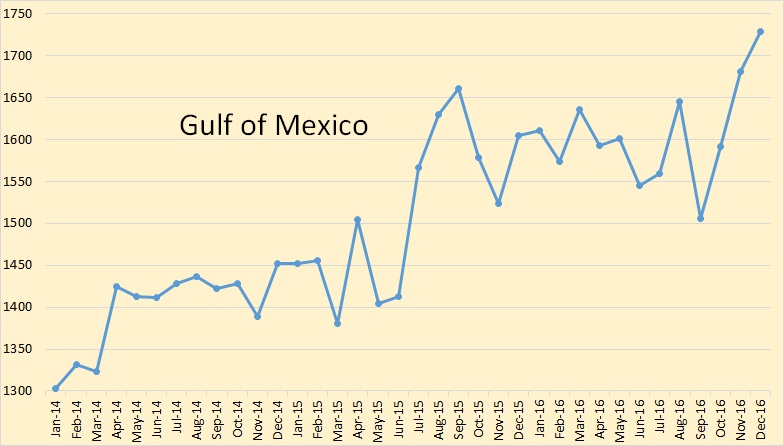
The EIA says the Gulf of Mexico was up 47,000 bpd in December.
So I just subtracted Alaska and the GOM from total US production to see what the the Lower 48 was doing in December. They were down 144,000 barrels per day. 89,000 of that was from North Dakota. Therefore the Lower 48 less North Dakota was down 55,000 bpd.
10 Comments on "Bakken January Production Data"
GregT on Thu, 9th Mar 2017 4:16 pm
Certainly does look like quite a few bell shaped curves, heading downwards.
Cloud9 on Thu, 9th Mar 2017 5:19 pm
Looks like Mad Max will be riding a bicycle.
Midnight Oil on Fri, 10th Mar 2017 12:20 am
Just need to invent a few more innovative techniques to be more efficient and productive.
Human ingenuity has never failed us yet!
There is plenty of hydrocarbons that only need to the right methods to come out to serve man and Capitalism.
Come on guys, don’t give up…Did the Americans wave the white flag when the Germans attacked Pearl Harbour?
Antius on Fri, 10th Mar 2017 6:23 am
‘Come on guys, don’t give up…Did the Americans wave the white flag when the Germans attacked Pearl Harbour?’
Ha! Ha! Sounds like a Bushism 🙂
Antius on Fri, 10th Mar 2017 6:45 am
Wouldn’t it be ironic if the rising price of oil turned out to be the thing that ruined the US shale industry? The fact is, whilst low oil prices may be bad for the turnover of the shale industry, they are good for the remainder of the US economy and allow for higher levels of debt to be carried. If oil prices increase sufficiently to put the US into recession and lead to more unserviceable debt in US financial institutions, it will inevitably lead to a cutback in capital intensive investments – like shale oil.
Cloggie on Fri, 10th Mar 2017 7:34 am
Did the Americans wave the white flag when the Germans attacked Pearl Harbour?’
Midnight Oil just revealed one of history’s best kept secrets.
Jerry Stubben on Fri, 10th Mar 2017 8:33 am
Oil is obsolete
rockman on Fri, 10th Mar 2017 8:45 am
“Oil is obsolete” From Merriam-Webster: obsolete = no longer in use or no longer useful. I would imagine the folks consuming 34 BILLION bbls of oil per year might disagree. LOL.
Jeff C on Fri, 10th Mar 2017 2:01 pm
isnt it always down in january?
Kingbreaker on Fri, 10th Mar 2017 11:54 pm
Those seem to be three year charts, so “always down in Jan” doesn’t reflect the data shown.