Peak Oil is You

Donate Bitcoins ;-) or Paypal :-)
Page added on November 17, 2016
IEA cuts coal growth outlook in half as China peaks

The International Energy Agency (IEA) has dramatically scaled back its outlook for coal demand growth over the next 25 years, Carbon Brief analysis shows.
The 2016 World Energy Outlook sees global coal demand rise by 214 million tonnes of oil equivalent (Mtoe) by 2040, less than half the 485Mtoe increase it expected last year. The IEA is also now persuaded that Chinese coal demand peaked in 2013.
Nonetheless, its central outlook sees coal use in 2040 being more than twice as high as needed for a 2C path. This coal disparity is the largest obstacle to meeting global climate goals, the report shows. Carbon Brief looks at what the World Energy Outlook means for coal and the climate.
Coal challenge
Coal is the world’s dirtiest fossil fuel. It was responsible for 46% of global energy-related CO2 emissions in 2014, the IEA says, despite meeting only 29% of demand for energy. As such, efforts to avoid dangerous climate change rely disproportionately on cutting emissions from coal.
The chart below illustrates this point. Current policies and pledges are expected to increase demand for energy across the board, including from coal, oil and gas. To shift to the IEA’s 2C path, coal use in 2040 must fall by 2,000Mtoe, to half of current demand.
Growth in energy demand to 2040, by fuel, under different IEA scenarios in millions of tonnes of oil equivalent (Mtoe). The difference between a 2C path (450 Scenario) and current policies and pledges (New Policies Scenario) is most significant for coal. Source: World Energy Outlook 2016. Chart by Carbon Brief using Highcharts.
In this context, the shift in the IEA outlook for coal is a positive sign for global climate efforts. The 2016 World Energy Outlook says coal demand will increase by 214Mtoe by 2040, whereas in 2015 it had expected an increase of 485Mtoe.
“After the rapid expansion of recent years, [coal] growth essentially grinds to a halt,” the IEA says. It now thinks demand will grow by 0.2% per year on average, half the rate expected last year and one quarter of the rate expected in 2012. (It’s worth adding that the IEA still forecasts growing coal demand, despite a record fall in global coal use last year.)
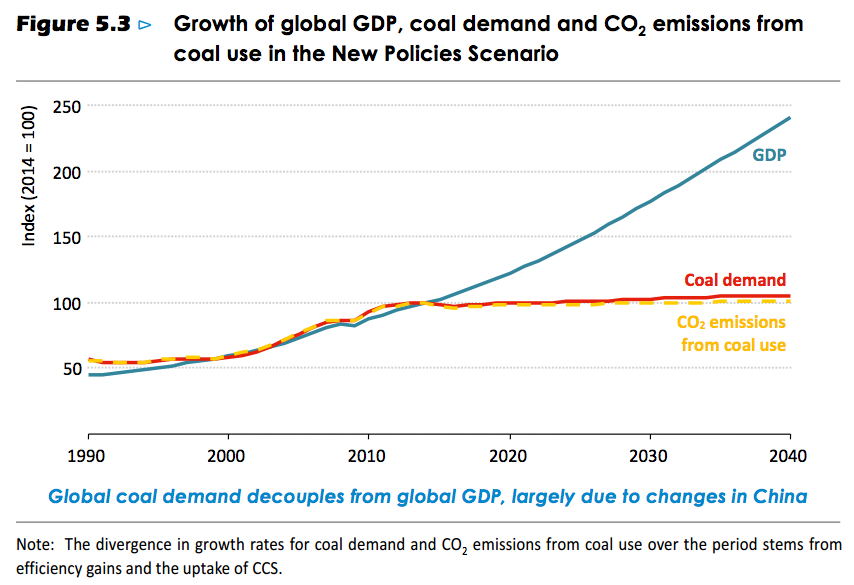
Growth of global GDP, coal demand and CO2 emissions from coal in the IEA’s central New Policies Scenario. The chart shows growth indexed to the levels in 2014. Source: World Energy Outlook 2016.
China peak
The outlook for coal is less rosy because the IEA is now persuaded that Chinese coal demand peaked in 2013. Last year it said that only a “dramatic slowdown” in GDP growth or an “unprecedented pace” of economic restructuring could trigger sustained coal reductions in China.
As a result, last year the IEA didn’t expect Chinese coal demand to peak until around 2030. Now, it sees demand falling 15% by 2040. Last year, it expected a 26% increase in the amount of power China gets from coal by 2040. Now it sees growth of just 4%.
Another way to look at this is that the IEA has cut its forecast for China’s coal-fired power output in 2040 by 907 terawatt hours (TWh), from 5,231TWh to 4,324TWh. This is equivalent to the total annual electricity demand of the UK (338TWh) and France (569TWh) combined.
Chinese coal demand could fall even faster than the IEA expects, given the waning impact of recent fiscal stimulus and reforms that will force grid operations to purchase minimum supplies from renewable sources that were previously curtailed.
The IEA expects China to continue building new coal plants, even though they will run less than 50% of the time. Its outlook has load factors falling to 43% in 2040.
The IEA notes: “China is set to surpass its energy and emissions targets”. Indeed, in the weeks before the IEA published its report, China laid out new targets for the power sector, including an overall cap on coal-fired power capacity and more ambitious targets for low-carbon supplies.
Tim Gould, head the WEO energy supply division, told a launch event in London:
“Coal had a very good first decade of the 2000s, but that boom is over. China led the charge. Chinese demand, in our view, has peaked and falls 15% by 2040…That is offset to a degree by what we see in India and southeast Asia.”
The report says:
“Lower income economies, notably India and countries in Southeast Asia, need to mobilise multiple sources of energy to meet fast growth in consumption; as such they cannot afford, for the moment, to neglect a low cost source of energy [coal] even as they pursue others in parallel.”
Paris compatible
The IEA’s lower outlook for global coal demand is a positive sign for climate efforts. However, the trajectory implied by current policies and pledges remains well short of what would be needed to avoid 2C of warming, as the chart at the top shows.
Fatih Birol, IEA executive director told a launch event in London: “The Paris pledges alone, even fully implemented, will not bring us to the 2C trajectory…let alone below that.”
Indeed, to avoid warming of more than 2C, every coal plant in the world will have to close by around 2050, unless it is fitted with carbon capture and storage (CCS), according to a second IEA report published this month (see chart, below left).
This second IEA report echoes Climate Analytics findings, which conclude that unabated coal must be phased out by 2050 for the Paris goals to be met.
The need to phase out unabated coal applies to plants in India, China and southeast Asia as much as it does to those in Poland, the US or Germany, though the timelines vary.
Though CCS will offer some coal plants a lifeline, this year’s scenarios have “considerably less” reliance on the technology, the IEA says, “given the slow pace at which CCS projects are being demonstrated and tested”.
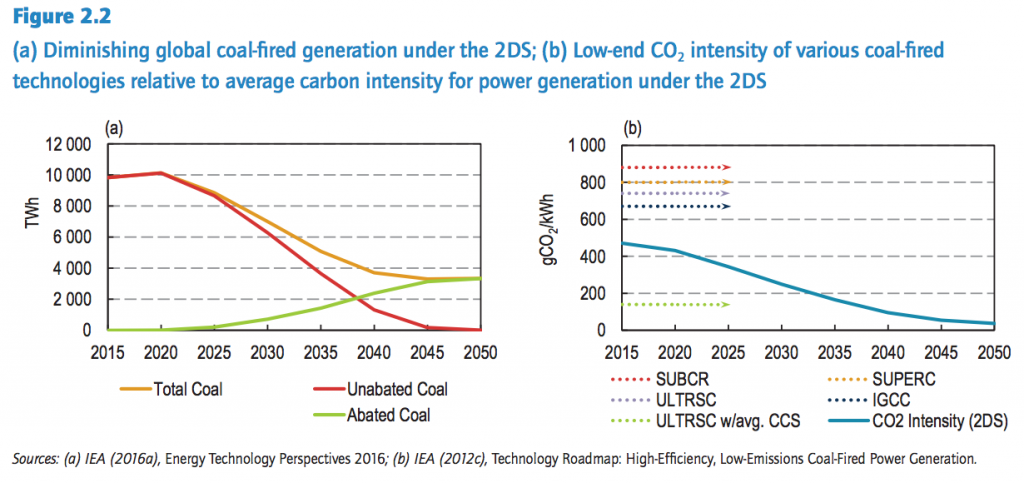
Left: Coal-fired power generation in the IEA’s 2C scenario. Abated coal uses CCS technology. Right: Average power sector CO2 emissions per kWh in the 2C scenario compared to the emissions from different coal plants. SUBCR is the least efficient subcritical coal. SUPERC is supercritical and ULTRSC is ultra-supercritical. IGCC is integrated combined cycle coal. Source: IEA Energy, Climate Change and Environment: 2016 Insights.
Even if the most efficient ultra-supercritical coal plants are fitted with CCS, they still emit around 150 grammes of CO2 per kilowatt hour (kWh) of electricity generated. This compares to a target range of around 80gCO2/kWh in 2040 in the IEA’s 2C scenario (see chart, above right).
Consequently, coal plants, whether fitted with CCS or not, have little role in IEA scenarios that attempt to meet the upper end of the Paris Agreement ambition. For a 1.5C limit, the IEA says:
“Coal use in power generation would drop dramatically, as its combustion, even with CCS, would entail residual emissions that would be increasingly challenging to compensate elsewhere.”
This is the first time that the IEA has drawn up Paris-compatible scenarios aligned to its warming limits of “well below 2C” and 1.5C. Dr Kamel Ben Naceur, director of the IEA’s sustainable energy policy and technology directorate, tells Carbon Brief that these scenarios will be developed further over the coming year.
The IEA’s “well-below 2C” scenario is based on a 66% probability of avoiding 2C, he explains. This implies a carbon budget that is some 20% smaller than in the IEA’s existing 450 scenario, which would give only a 50/50 chance of avoiding 2C.
Conclusion
The latest World Energy Outlook from the IEA presents mixed news for the climate. It drastically downgrades the outlook for coal demand growth over the next 25 years and concludes that coal demand in China has peaked.
Yet it says that poorer countries cannot afford not to use more coal, even as its scenarios show that global coal demand must halve by 2040, to secure any chance of avoiding 2C. It also fails to repeat the clear message of its Energy, Climate Change and Environment report, which is that all unabated coal plants must close by mid-century to avoid dangerous warming.
Either way, the IEA confirms that tackling coal is the biggest obstacle to meeting the aims of the Paris Agreement. Though the outlook fails to say this explicitly, the message is clear.
Addendum
Today, the US published its mid-century plan for “deep decarbonization”. It would see unabated coal use completely phased out by 2050.
Following the election result, however, the trajectory of US energy use is uncertain. President-elect Trump has pledged to scrap the Clean Power Plan and to reinvigorate coal. He is also likely to prove more sympathetic to car industry lobbying against vehicle efficiency standards.
The IEA’s outlook give some insight into the range of outcomes for US energy use and emissions, depending on which policies are retained and which are gutted.
For instance, its Current Policies Scenario, despite not including the Clean Power Plan, shows coal demand in 2040 falling by 22% from current levels. If the Clean Power Plan had proceeded, coal demand would have been expected to fall by 38%, the IEA says.
It’s worth noting that both of these scenarios assume rules on mercury emissions remain in place. While Trump could reverse the Mercury and Air Toxics Standards, many coal plants have already opted to either retire or install costly pollution control equipment in response to the rules.
Similarly, the IEA sees oil demand falling by 13-27% by 2040, depending on whether new, more stringent car efficiency standards and electric vehicle mandates are adopted.
Overall, the IEA had expected US emissions to fall from 5,155 million tonnes of CO2 (MtCO2) in 2014 to 3,888MtCO2 in 2040 if the country had implemented planned climate policies, a reduction of 1,267MtCO2 or 25%.
Even if the Clean Power Plan and tighter fuel standards are never adopted, the IEA sees US emissions falling by 495MtCO2 by 2040, a 10% reduction. The additional 772MtCO2 of US emissions in 2040 would raise expected global energy-related emissions in 2040 by 2%.
If a Trump administration were to roll back policies that are already in place, such as the recently extended tax credits for wind and solar or current vehicle fuel standards, then all bets are off as to the path US energy use will take.
33 Comments on "IEA cuts coal growth outlook in half as China peaks"
rockman on Thu, 17th Nov 2016 7:52 pm
Oh right! I get another chance to redo an IEA headline:
IEA predicted rise in global coal demand by 214 million tonnes enough to significantly increase climate change
Nothing like a little reverse spin to make my day. LOL.
yoshua on Fri, 18th Nov 2016 1:27 am
Chinas coal production has fallen 10% this year.
Davy on Fri, 18th Nov 2016 5:18 am
These articles are poor economics and science. We should not be forecasting out trends to 2040 considering the extremes of nearly every metric to modern man. We are already shot our wad with 2C. Check out this news: “The North Pole is an insane 36 degrees warmer than normal as winter descends” http://tinyurl.com/j4lp3pq . We are already in a post 2C world according to the Arctic. Economically, I want someone to tell me with all the global financial issues how we are going to realize the graph that shows steady rising global GDP out to 2040? That projected growth is for 3 more Chinese size economies. Pleeeze, these things just don’t add up to a firm reality test with science, current events, and common sense.
Chinese coal has peaked because the Chinese economy has peaked. It will likely fall considerably as the global economy deflates and demand destruction becomes the dominant trend. China is a heavy industry export economy. There is no future for that kind of economic model and ditto for the rest of Asia.
Trump’s policies are irrelevant in regards to growth but very relevant to a path of economic decline. He is not going to make big energy changes because the energy trends are baked into the cake. The US is heading into a recession that will never end. It may bounces around on that path down but the days of solid and healthy growth are over. Trump will be a failure economically by traditional standards but he will have initiated a slowdown sooner and thereby become a catch 22 type success for reasons of adaptation and mitigation to the collapse process. Trump may just disrupt the status quo enough and by doing so save it at a lower level for a little longer. If you are facing a terminal illness and the doctor says you might have another year of life would you not be happy? That is the extent of my optimism over Trump. He checked the establishment somewhat and he will hasten economic decline. He may reduce the chance of WWIII. Otherwise he will be just another worthless American leader like a long list of failures. Globalism is an American design and in that regard the US deserves a collapse.
Sure I am speculating here but Trump offers some room for speculation where Hillary would not have. We must have an economic crisis soon to change the trajectory of collapse. That is my opinion on the collapse process. Maybe I am being wishful but from my collapse studies these kind of disruption to the status quo like Putin started with his rejection of the western way and them Brexit and Trexit (Trump exit) will create alternative consequences. Alternatives to globalization are all negative because globalism must grow and at a minimum operating level to avoid dangerous entropic decay. The economy is not a constant and we should not expect steady and growing GDP just because that is what we had. We must admit that these events will effect global trade and finance and since both are in trouble we should expect more trouble. This may not happen immediately but this negative trend has likely hastened. This vital decline process may have been delayed several years more without these anti-globalization forces.
The trend was increasing globalization and economic integration along an established trend. We now have an alternative path. We should not expect a continuation of a globalization enhancement process but a new process which is are negative consequence of a new anti-globalism direction. There is no alternative to globalism in regards to increased growth. This does not mean growth at this point is good. Growth now is taking us into a worse collapse process. We need to peak and gently roll down the gradient of collapse. We don’t want to peak far beyond a level of collapse adaptation. We have already gone too far with population and economies of scale. The hard part is ahead in reducing population and bringing a global economy closer to sustainability. More growth through a green path is not the answer either. The answer is a cold hearted and dangerous decline that is hopefully less severe than what it could be. I am trying to have a realistic hope but there may be no hope. This is uncharted waters of dangerous dramatic changes to modern man at all levels. Is it too much to hope for less pain and suffering?
Davy on Fri, 18th Nov 2016 6:36 am
An interesting take on Trump.
“Welcome to the Brave New (Trumpolitical/Trumponomic) World”
http://tinyurl.com/jhnj256
Boat on Fri, 18th Nov 2016 7:35 am
To replace coal there has to a cheaper alternative. Improved tech with wind and solar. If cost reductions continue like the last 5 years the Eia will be making many more adjustments to chart the demise of coal.
rockman on Fri, 18th Nov 2016 7:42 am
“Chinas coal production has fallen 10% this year”…remaining 400% higher then in 2000.
BTW: “China boosted coal imports to the highest in more than a year as domestic production slips amid the government’s drive to cut overcapacity. China’s coal imports will continue to rise as the country’s production cuts have created a supply shortfall,” Deng Shun, an analyst with ICIS China”
China’s increase in coal imports from Australia explains the increase in price from $55/ton to $100/ton in just 6 months.
http://www.indexmundi.com/Commodities/?commodity=coal-australian&months=12
yoshua on Fri, 18th Nov 2016 8:05 am
Rockman – Chinas coal production has peaked and is now in decline. China is closing down uneconomic coal mines and is forced to import coal to cover the decline.
rockman on Fri, 18th Nov 2016 8:16 am
“…the Eia will be making many more adjustments to chart the demise of coal.”
From the EIA 2016 ENERGY OUTLOOK REPORT: “8.8 GW of coal-fired units are being converted to natural gas-fired steam units between 2016 and 2025”. IOW less GHG then coal but still GHG.
And from the IEA:
“200 MW/day new coal generation capacity commissioned in the world in 2010-14.”
“The region with the highest growth rate in coal use in the outlook period is in Southeast Asia, where Indonesia, Viet Nam, Malaysia and Philippines among others plan to underpin their power generation with new coal power plants. Unfortunately, around half of the new coal-fired generation capacity under development in the region still uses inefficient subcritical technologies.”
The IEA also projects global coal consumption thru 2040 to remain at the highest level ever seen since in history. That will be partly aided by the highest US coal exports in history with the majority coming from US govt leases.
rockman on Fri, 18th Nov 2016 8:25 am
yoshua – Yes, exactly as I posted. Just added the fact that reduced Chinese production has ramped up demand for imported coal sufficient to almost double the price. IOW decreased Chinese coal production DOES NOT indicate the country turning away from coal as a significant component of its energy future, does it?
yoshua on Fri, 18th Nov 2016 9:55 am
Rockman – Ok, I see now. Almost looks as if king coal is leading oil prices. It is a strange world out there.
http://www.indexmundi.com/Commodities/?commodity=coal-australian&months=360
rockman on Fri, 18th Nov 2016 12:10 pm
yoshua – That’s why I respond to the “King Coal is dead” threads with details. Such as US and global coal consumption was doing just fine when NG and LNG prices were 400% or more higher then today. Some will take such a short term trend of just a few years and project it out for decades. But if one looks back decades at the previous trends it seems clear that despite short term bumps in the road King Coal has been growing quit well for more then half a CENTURY.
Of course there’s now the potential for the alts to take some of the shine off the King’s crown. But the same much lower NG/LNG prices that cut into coal have also reduced the financial incentive for the alts.
But along those lines I heard an interesting story on NPR just yesterday. According to them there are only two US cities of significant size (50,000+) that have significant ongoing actions to go 100% renewable: Georgetown, Texas (a distant suburb to the capital Austin) and Burlington, Vt (?). Georgetown’s spokesman made it very clear: its plan has NOTHING to do with environmental concerns…it’s purely economical. Specifically being a Texas town they understand energy price volatility as well or better then most. The focue isn’t on short term electrical costs (which are low today) but on the next 20+ years. Thus the city’s support of alt energy. And it isn’t building its own infrastructure. Texas utilities have programs: pay a modestly higher rate now with those monies used to expand alt infrastructure by the utilities and lock in long term lower rates. Austin voters chose such a plan years ago.
Same motive behind the largest CO2 sequestration project in the world about to come on line in Texas: it will allow the second largest source of US GHG to continue burning our 100+ year reserve of cheap and low Btu lignite.
It’s really odd isn’t it: someone who has spent 40+ years hunting for and producing fossil fuels is often the one correcting overly enthusiastic expectations of some “greenies” who want to argue the fossil fuel industry is losing control. You would think it would be just the opposite: an oil patch hand wouldn’t be taking the role of “whistle blower”. LOL.
The world really isn’t that “strange”. The vast majority of the energy consumers have a very single minded attitude about growth: they will burn fossil fuels regardless of the effect on the climate if that’s what it takes to improve their lives. Self-centered, yes. Strange, no. LOL.
yoshua on Sat, 19th Nov 2016 5:18 am
Rockman it actually looks as if US natural gas prices are leading the price of coal and oil if one looks at the charts. But that is crazy? US natural gas produced mainly for the US market can’t have that much effect on global coal and oil prices? Even if the US is the swing consumer.
US natural gas and oil where of course in decline when all energy prices started to rise. The shale gas and oil production changed that and made the US at least natural gas independent and North America close to oil independent while the US has always been coal independent.
The question I guess is… Is the shale oil and gas production economically viable? I guess we will find that out in the future.
Boat on Sat, 19th Nov 2016 6:34 am
Rock,
http://www.eia.gov/state/seds/data.cfm?incfile=/state/seds/sep_use/tx/use_tx_TX.html&sid=TX
Texas coal consumption in 2000 according to the Eia was 73.3 million short tons. By 2014 it was down to 27.7. Coal is dying in TX. At coals peak coal consumption was over 90.
yoshua on Sat, 19th Nov 2016 7:32 am
Rockman have you seen BP’s energy use statement?
Do the numbers they present the energy to run the machinery… or do they represent fuel, machinery, workforce… the total energy use to maintain production… down to the last cup of coffee?
yoshua on Sat, 19th Nov 2016 7:33 am
The BP link: http://www.bp.com/en/global/corporate/sustainability/environment/energy-use.html
rockman on Sat, 19th Nov 2016 7:38 am
yoshua – “US natural gas and oil where of course in decline when all energy prices started to rise”. Actually NG wasn’t in decline. It’s been pretty much on a plateau since the 70’s. In fact it had been gradually increasing since to mid 80’s until just before the NG shale boom began. But yes: the shale boom brought us to all time record high production. Oddly a part of that happening (in spite of much lower prices in the last 5 years) was as insufficient amount of oil potential for PUBLIC COMPANIES. Those companies are primarily valued on their reserve gains. Doesn’t matter if it’s bbls or cubic feet: they are all converted to $’s.
https://www.eia.gov/dnav/ng/hist/n9050us2a.htm
yoshua on Sat, 19th Nov 2016 7:46 am
Boat has coal peaked in the US as well?
yoshua on Sat, 19th Nov 2016 7:54 am
US peak coal took place in 1966.
http://www.eia.gov/state/seds/data.cfm?incfile=/state/seds/sep_use/tx/use_tx_US.html&sid=US
rockman on Sat, 19th Nov 2016 8:07 am
Joshua – Price differentials: no simple answer. Utility can be a much bigger factor the Btu content or the local/global market. The obvious: no matter how cheap/available NG might be you and the vast majority of the world are still going to fill your gas tank this week with fuel made from gasoline. Likewise if you local utility were giving NG away for free you couldn’t warm your house with it if you’re not on the local NG distribution grid…just as the Rockman isn’t.
Here’s a variety of data to give some sense of how prices, Btu content, availability and utility make for a confusing and occasionally contradictory situations.
One challenge in comparing the cost of heating with gas, oil, and electricity is that each is sold in much different units. Natural gas is often billed by the therm, while heating oil is sold by the gallon. Electricity is metered by kilowatt-hour, or KWH. Our old friend from across the pond—the British thermal unit, or BTU—gives us a unit we can easily use for our comparison.
Specifically, let’s begin by pricing each fuel per 100,000 BTU of energy.
With natural gas, the conversion is easy: One therm equals 100,000 BTU, and a good going rate is about $1.10 per therm. So:
Cost of natural gas = $1.10 for 100,000 BTU
Now, for heating oil: Let’s say we buy our heating oil for $3.50 a gallon. Heating oil is rated at about 140,000 BTU per gallon. So,
Cost of heating oil per 100,000 BTU = $3.50 per gallon * 100,000 BTU / 140,000 BTU per gallon
Cost of heating oil = $2.50 for 100,000 BTU
Finally, let’s turn to electricity. Let’s say one KWH costs $0.10. One KWH equals 3,413 BTU, so to calculate the price of 100,000 BTU, we use this equation:
Cost of electricity per 100,000 BTU = $0.10 per KWH * 100,000 BTU / 3,413 BTU per KWH
Cost of electricity = $2.93 for 100,000 BTU
At first glance, it looks like gas is the most economical choice followed by oil and then electricity. Of course, it’s not quite that easy. Differences in efficiency give some types of electrical heating an advantage
Then there’s the seasonal price swings: winter heatings, summer AC and driving. There there’s longer term swings: June ’08: $12.70/MCF…and 12 months later: $3.80/MCF. Obviously the drilling dynamic can’t readily adjust to such swings.
Bottom line: in the vast majority of the major dynamics fuel switching isn’t viable except in the very long term. And even then it’s still difficult/expensive.
And now let’s see what BP has to say.
rockman on Sat, 19th Nov 2016 8:33 am
yoshua – “Do the numbers they present the energy to run the machinery…”. I would say yes. Doesn’t include imbedded energy in drill rigs, refineries, pipelines, office buildings, etc. IOW direct energy inputs like diesel burned on a drill rig or NG used in a refinery used in the oil refining process.
I can’t address the downstream (refining etc) energy consumption…not my world. But you may have noticed my constant lecturing how relatively little energy is used to drill and produce oil/NG compared to what many “civilians” believe. Lately some truly absurd numbers for the cost to produce EXISTING WELLS. I’ve pointed out that spending $10/bbl to produce oil IS NOT a low cost operation. In the vast majority of cases that’s very expensive. And I’m talking $’s and not Btu’s. My LOE’s (Lease Operating Expenses) run $0.50 to $3 per bbl. And the $3/bbl is for a field I have to constantly pump it out with electricity and 85% of the production is water.
Other then that I would take any number BP puts out with a tad of skepticism. Lots of assumptions/number massagings are done to get to such answers.
Boat on Sat, 19th Nov 2016 10:41 am
Yoshua,
Googling actual numbers of history puts the present in context. Yea, the peak was 1966.
Your BP link was good. Interesting. They put out out a yearly world energy report that is good as well. Generally close to what the Eia reports.
yoshua on Sat, 19th Nov 2016 11:56 am
Rockman thanks!
GregT on Sat, 19th Nov 2016 12:01 pm
Texas, just like almost every other region on the entire planet, has exported coal consumption to Asia, in exchange for cheap consumer goods. To pretend otherwise is to be disingenuous.
yoshua on Sat, 19th Nov 2016 12:02 pm
Boat, Gail gave me this report from EIA. According to this report US coal production peaked in 2008. Gail thought that the other report which shows 1966 had to do with end use and not total production.
yoshua on Sat, 19th Nov 2016 12:03 pm
And the EIA link: http://www.eia.gov/totalenergy/data/monthly/pdf/sec1_5.pdf
Boat on Sat, 19th Nov 2016 2:18 pm
Greggiet,
And who was talking about US exports.
Boat on Sat, 19th Nov 2016 2:29 pm
Yoshua
Gail’s chart is not measuring coal short tons. You and I were looking at short tons as the metric.
rockman on Sat, 19th Nov 2016 3:09 pm
Greg – Texas has never exported a single pound of OUR coal/lignite. Not one pound. Not that we wouldn’t if we could but as for the export potential of our very low grade lignite it ain’t worth sh*t. LOL.
But we have exported a lot of coal mined IN OTHER REGIONS. In fact, thanks to President Obama expediting the permit requests to expand our coal export terminals we are, for the very first time, exporting western coal (much of it from govt leases) that’s shipped by rail here instead of the west coast. Such as: Kinder Morgan Energy Partners expanding its existing annual coal capacity at the terminal in the Port of Houston from 5.4 to 9 million tonnes per year.
In fact Texas isn’t the only state benefiting from exporting coal FROM OTHER REGIONS: “While environmental opposition has stymied plans to build terminals in California and the Pacific Northwest, the Mississippi River town of Darrow, Louisiana, has a new $300 million export facility. It’s part of a regional expansion that will increase capacity by 66 percent to 119 million metric tons by 2017, or more than half the national total.
At least $898 million, or 64 percent of the total $1.4 billion companies such as Ambre Energy Ltd. were planning to invest on the West Coast, is being spent on terminals in the Gulf of Mexico.” So again the Gulf Coast thanks President Obama for approving the expansion of our coal export capacity.
Trust me: Texas would very much prefer manufacturing products here by burning fossil fuels then shipping those hydrocarbons overseas. In the last couple of years we’ve welcomed with open arms European companies that burn a lot of fossil fuels in their manufacturing process. They relocated specifically to Texas because of the low cost and long term availability of our fossil fuel reserves.
Maybe you aren’t aware but Texans as a whole don’t give a sh*t about producing GHG or impacting climate change. Our world class alt energy expansion and the world’s largest CO2 sequestration project about to begin operations weren’t done to “save the planet” or done “for the children”. The only reason Texas coal consumption has gone down is by switching to more economical NG. It sure as hell wasn’t for environmental reasons: it was just good business. When NG prices inevitably go back up we’ll go back to burning as much of our 100+ year supply of lignite as needed to keep our title as the largest national electricity consumer.
Coal or NG: either way we’re continuing to produce a lot of GHG.
GregT on Sat, 19th Nov 2016 3:15 pm
INTERNATIONAL ENERGY OUTLOOK 2016
Overview
In the IEO2016 Reference case, coal remains the second-largest energy source worldwide—behind petroleum and other liquids—until 2030. From 2030 through 2040, it is the third-largest energy source, behind both liquid fuels and natural gas. World coal consumption increases from 2012 to 2040 at an average rate of 0.6%/year, from 153 quadrillion Btu in 2012 to 169 quadrillion Btu in 2020 and to 180 quadrillion Btu in 2040.
Throughout the projection, the top three coal-consuming countries are China, the United States, and India, which together account for more than 70% of world coal use. China accounted for 50% of world coal consumption in 2012, and its coal use continues to grow through 2025 in the Reference case before beginning a decline along with slower overall growth in energy consumption and the implementation of policies addressing air pollution and climate change. In 2040, China’s share of world coal consumption falls to 46%.
https://www.eia.gov/forecasts/ieo/coal.cfm
China continues to be the world’s leading manufacturer of consumer goods, and the US continues to be the biggest importer and consumer of those same said goods, largely manufactured with coal.
http://wits.worldbank.org/CountryProfile/en/Country/CHN/StartYear/2010/EndYear/2014/TradeFlow/Export/Indicator/XPRT-TRD-VL/Partner/All/Product/UNCTAD-SoP3
yoshua on Sat, 19th Nov 2016 3:46 pm
http://www.indexmundi.com/energy/?country=us&graph=production+consumption&product=coal
Boat US coal production in short tons.
GregT on Sat, 19th Nov 2016 4:12 pm
@Boat,
“And who was talking about US exports.”
Certainly not you or I. We were both talking about consumption. Whether that coal is being burned in the US or China makes no difference, when the end product is being consumed in Texas.
rockman on Sat, 19th Nov 2016 4:25 pm
Boat/yoshua – Latest numbers from the EIA regarding US coal. From
http://www.eia.gov/todayinenergy/detail.php?id=24472
“Since reaching a high point in 2008, coal production in the United States has continued to decline. U.S. coal production in 2015 is expected to be about 900 million short tons (MMst), 10% lower than in 2014 and the lowest level since 1986.”
And at 900 million short tons the US is the second largest coal producer of all the countries on the planet. With respect to the value of coal exports the US is #4 in the world:
Australia: US$28.4 billion
Indonesia: $16.4 billion
Russia: $9.3 billion
United States: $5.7 billion
So with respect to the realm of King Coal obviously the US is one of the crown princes. It sure the f*ck isn’t one of the rebels trying to overthrow the monarchy…regardless of what spin any POTUS has spun. LOL.
And speaking of money:
A department report from June 2013 details just how profitable the coal business is for the department and BLM:
“The Bureau of Land Management (BLM) in the U.S. Department of the Interior (Department) oversees coal mining activities on Federal (public) and Indian lands.
The Department collects more than $1 billion in bonus and royalty revenues from coal mining companies each year, a figure that has been steadily rising. In fiscal year 2012 (in the middle of President Obama’s terms in office) bonuses and royalties exceeded $2.4 billion, the highest amount recorded in the last decade.”
BTW did y’all see the big press conference where President Obama discussed his plan to increase the royalty of new federal coal leases 300%. That’s a lot of money when one considers that 40% of all US coal production came from those federal leases President Obama has managed the last 8 years.
Dang, I also missed it. And gosh, I also missed his speech annoucing his approval of Shell Oil’s permit request to drill on those govt leases in the Arctic. I really need to pay closer attention to those big news stories put out by our MSM. LOL.
yoshua on Sat, 19th Nov 2016 5:05 pm
Rockman US coal production is of course still high and Chinas coal is even higher and coal will continue to rule… but they have peaked.
US coal production peaked in 2008 at 1,200 million short tons and is now down to 900 million short tons. That is still a significant decline in production.
Here in Europe basically only Germany and Poland have coal and basically only they are still doing economically fine.
In Finland where I live exports have fallen by 10% the last year. We have no oil, gas or coal. We are a small super power in peat though.
King Coal is still the fuel that has powered the industrial civilization. What will Peak Coal dynamics look like? I don’t know if there even is a real discussion about that.