Peak Oil is You

Donate Bitcoins ;-) or Paypal :-)
Page added on May 23, 2016
This is Peak Oil

In the last press review of 2015 I asked if that had been the year petroleum peaked. The question mark was not just a precaution, the uncertainty was really there. Five months later the reported world petroleum extraction rate is pretty much still where it was then. This is not a surprise, but the impact of two years of depressed prices is over due.
Nevertheless, during these five months of lethargy the information I gathered brings me considerably closer to removing the question mark from the sentence and acknowledging that a long term decline is settling in. Understanding the present petroleum market as a feature of the supply destruction – demand destruction cycle makes this case clear.
Looking Backwards
Worldwide petroleum extraction hit some sort of ceiling back in 2004, once it crossed above 70 Mb/d. The volume coming to the market kept increasing, but at a shy pace. From 2004 to 2012 the extraction rate grew only 3%, from 72 Md/b to 74 Mb/d.
At the same time, the Brent index endured a remarkable rise from 2004 to 2008. Some called this the “end of cheap oil”, alluding to the increasing need for lower return-on-investment resources: ultra-deep water, heavy petroleums, Arctic, etc. Nevertheless, the price collapsed by a third from 2008 to 2009. Back then I explained how the concept of an ever rising petroleum price was at odds with “peak oil”. For the world extraction to enter a declining trend, periods of supply destruction must take place to keep those higher entropy resources at bay.
Today the market is going through the second supply destruction cycle since the 2004 shift. In reality these cycles are taking far longer than I anticipated, showing a considerable time lag in the adjustment of the supply curve. There is however something special about this supply destruction cycle that could possibly be sealing the end of growth as far as petroleum is concerned.
The Miracle
Some days ago I had the opportunity to watch a picture titled “The Big Short”, an opus on the 2008 financial crisis. It portrays remarkably well how the marriage of ignorance with the lack of scruples can concoct the most toxic of outcomes. The so called “shale oil boom” is not much of a different story, only perhaps at a different scale.
From 2011 to 2013 the extraction of petroleum from source rocks and other low permeability reservoirs in the US grew almost 2 Mb/d. These were remarkable days for the industry, with plenty of jobs created and a major revival to the American hands-on approach to business. However, such a rapid growth on a relatively small resource left many wondering if something else was at play.
By the beginning of 2014 it was becoming evident that the “shale oil boom” had been largely fuelled by the finance industry that was feeding relentless amounts of what is sometimes called “dumb money” to be burned on America’s source rocks. The scheme was simple: petroleum companies inflated their reserve assessments 10 times or more and imprudent investors kept buying bonds irrespective of losses. They thought they were investing on conventional 30 years petroleum bearing wells, when in fact they were getting 3 years lifetime wells.
By late 2014 “shale oil” extraction in the US had increased 3.5 Mb/d since 2011, but at that point the price of petroleum in international markets was already coming off a cliff. 200 G$ rested on the American junk bond market, left to be trounced by a deep supply destruction cycle.
A bond default and bankruptcy wave formed throughout 2015, and is still surging today. One third of the companies involved in the “shale boom” should go belly up this year alone. However, these financial woes have not yet translated into a visible decline in extraction rates. This means that even bankrupt petroleum companies are still bringing new source rock wells online, only deepening further the present supply destruction cycle.
When the WTI index (the regional equivalent to Brent) sank under 40 $/b late last year, Arthur Berman produced a most elucidating set of maps spatially portraying well profitability. At those prices only a small fraction of the wells extracting petroleum in the Permian formation were profitable.

And this is the remarkable achievement engendered by the marriage of America’s petroleum and finance industries. Petroleum extraction became effectively insulated from prices; bankrupt or not, the wells on the Permian, Bakken and Eagle Ford formations will keep pumping – because the dumb money keeps burning. For the rest of the world, this is like inserting a sliver of 4 Mb/d at 0$ at the far left of the supply curve, pushing all other resources rightwards. For an international industry already in contraction, this is like adding gasoline to the fire.
Supply Destruction
The present supply destruction cycle dates back to the beginning of 2014 – it actually unfolded before the price collapse. While prices still held above 100 $/b, international petroleum companies started facing issues regarding shareholder revenues. The supply curve is simply becoming too steep, when resources such as “Arctic oil” or “pre-salt” enter the portfolios of petroleum companies. The scale down of exploration activities started that year, as also the slashing of staff. In 2014 circa 100 000 jobs were laid off by the industry.
The price rout brought about by the shale miracle only accelerated this contraction. In 2015 the number of jobs laid off is estimated to have hit 250 000. 2016 could end up close to that.
In panic mode, petroleum companies have been postponing or outright cancelling projects. Recent estimates point to a total of 400 G$ in deferred investments. A new wave of mergers in the industry is now expected.
Throughout 2015 only 2.8 Gb were identified in new reserves, the lowest score since the end of the II World War. This figure is less than one tenth of yearly consumption.
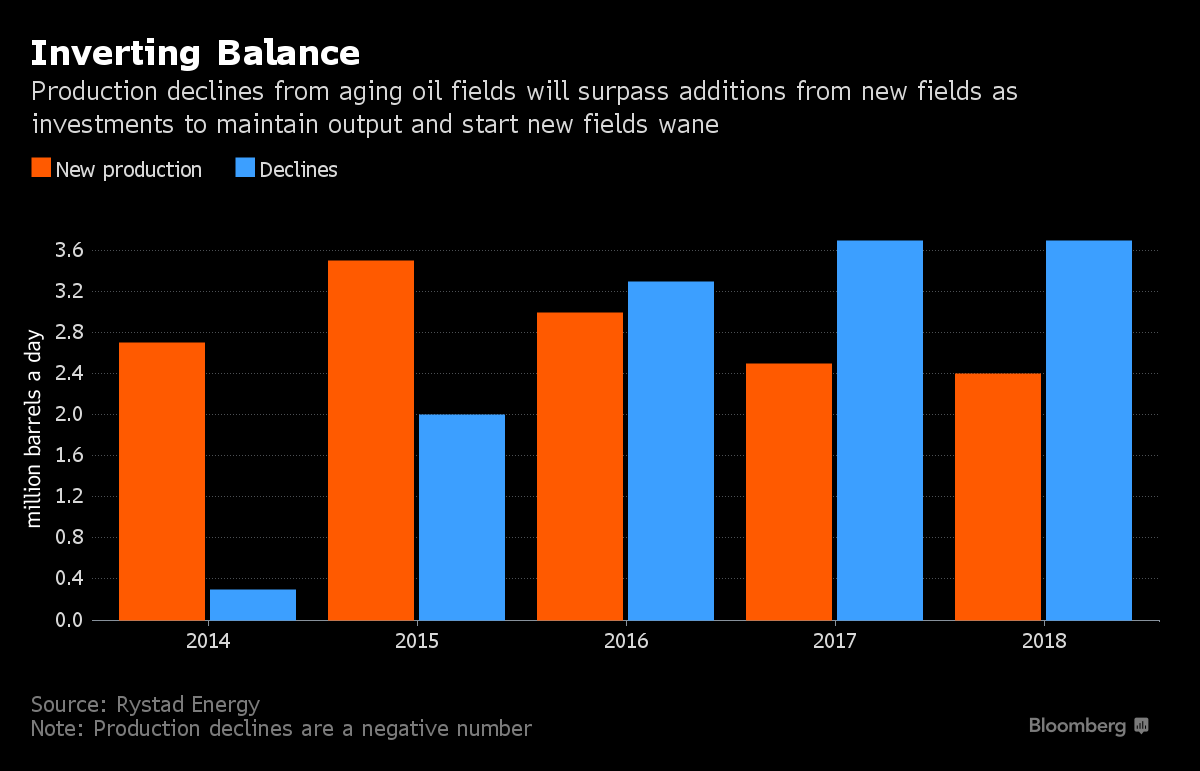
This contraction cycle will resound for years to come. Existing fields decline at a rate somewhere between 4 % to 5 % per year, meaning that the industry needs to bring online additional 3 Mb/d to 4 Mb/d every year just to keep extraction level. The investment deferrals under way and the time lag required to bring new fields online guarantee this replacement will be missed several years going forwards.
Rystad Energy, a Norwegian petroleum and gas business intelligence consultancy, projects new extraction projects to miss the yearly decline of existing fields for at least the next five years. This consultancy expects an overall extraction decline of 300 kb/d this year, 1.2 Mb/d in 2017 and 2018 and deeper declines in 2019 and 2020.
Looking Forwards
In a previous post I analysed the gap between petroleum extraction and consumption reported by the IEA. Using data fragments published by the press I then produced an estimate for China’s stock flows that greatly explains what have been heretofore unaccounted barrels. In essence, the OECD and China could have amassed together a total of extra 900 Mb in stocks since the beginning of 2014.
Using this estimate for worldwide stocks I was then able to compute world petroleum consumption for the past two years. There are also reasons to believe the IEA is underestimating consumption, but this estimate produces a conservative (nearly best case) scenario: growth of 1.25 %/a.
Matching the outlook produced by Rystad with this consumption trend one can start the always risky exercise of predicting the future. In this case I projected forwards the consumption pattern of 2015 – with a double slump in later Winter and Spring, and the Summer up-tick – increasing at the steady pace identified before. As for extraction, I simplyspread Rystad’s outlook into a monthly dataset. The end result can be observed in the graph below.
Editorial note: Please see original graph on Luis’ site here.
The extraordinary stocks built by the OECD and China since 2014 are projected to hit 1 Gb right about now, but also to soon stop growing. None of this counts in the fires in Alberta, or the social-economic woes endured presently by Nigeria or Venezuela. Still, in this conservative scenario consumption is just about to exceed extraction.
In the scenario above I also added in the exercise of estimating how long can these extraordinary stocks last if they are immediately released on the market to stave off an immediate price reaction. That being the case, the extra stocks built by the OECD can alone keep consumers happy until the end of 2017; to go beyond that China has to follow the same strategy. However, if the trends identified here prevail, by the beginning of 2018 consumption will be exceeding extraction by almost 3 Mb/d, exhausting the remaining stocks of 0.5 Gb in a matter of months.
How likely is this scenario? Is the OECD willing to bring its stocks promptly on the market to keep prices where they are now? Or will it wait for prices to rise to provide breathing space to the petroleum industry? And for how long can countries like Iraq, Nigeria or Venezuela withstand prices under 100 $/b?
As the events of recent months show, it might be far more likely for some disruptive happening to shake things up, than for these pretty trends to endure. In any case, this supply destruction cycle is coming to an end sooner rather than later. The market will eventually have to fix the widening gap projected in the graph above.
Consequences
These two years of supply destructive prices have pushed various important petroleum nations and regions to the brink. If there is some unexpected event shaking up the petroleum market, it will likely be in one of these places.
Iraq – a country at war and divided into four different zones of military influence. The impact of low petroleum prices on the Bagdad budget is postponing a victory over Daesh and brewing political chaos. The increase in extraction of recent years halted and could reverse if the politico-military situation does not improve. Daesh’ scorched earth policy is not helping either.
Nigeria – shortages of hard currency have greatly impaired daily economic life and an IMF intervention seems likely. In parallel, rebel groups have entailed a series of sabotage operations on petroleum assets. Petroleum extraction should decline visibly in the next few years and some fields even abandoned if petroleum prices stay below 60 $/b.
Venezuela – overwhelmed by a snowball effect where under-priced petroleum causes such economic disruption that impacts extraction itself. Exporting less petroleum for less money and on the verge of serious social convulsion.
Canada – petroleum regions in depression threaten to drag down the whole economy with visible impacts on housing and all industries related to extraction. Number and size of new projects greatly reduced in recent months may augur an almost unthinkable long term extraction decline in the country with the largest claimed petroleum reserves in the world. The long term effect of the wild fires raging presently in Alberta is still unknown. If petroleum facilities are destroyed, it might not be easy to recover with prices under 50 $/b.
Angola – ran out of hard currency reserves to pay foreign contractors, sending the latter on the run. Presently negotiating an aid programme with the IMF. Meanwhile, the ruling regime has imprisoned numbers of opponents. Petroleum extraction bound to decline in the next few years.
Azerbaidjan – for long in “secret” talks with the IMF over an aid programme. Ambitious prospects for export hikes are likely unattainable.
Mexico – lost 1 Mb/d to depletion during the past ten years and is unlikely to hold or halt the decline. Relevant downwards reserve revisions have been conducted in recent times.
Brasil – engulfed in political chaos tied to misuse and mismanagement of its national petroleum company, Petrobras, one of the most indebted companies in the world. The pre-salt resource seems adjourned sine die.
North Sea – extraction is expected to stop in 100 different fields throughout 2016.
Conclusion
Depending on how the OECD (and perhaps China) decide to manage their extra petroleum stocks, the shift to a new demand destruction cycle closing the gap portrayed in the graph above will be complete by early 2018 at the latest. If something goes seriously wrong with one of the key petroleum exporting nations, this shift could happen overnight.
What will such a new cycle bring? Recent experience provides some clues: it took eight years for world extraction to rise from 72 Mb/d to 74 Mb/d; the so called “shale boom” required four years at prices above 110 $/b. These long time lags mean that Rystad’s declining outlook is by this time almost certain.
The coming demand destruction cycle is therefore likely to be a long one too. And at some point it can invert the extraction trend upwards. In such a scenario, can extraction return to the 80 Mb/d rate of 2015? That is the big question, which I will abstain from answering definitively. Looking at it from the other side of the equation, for such a scenario to ever materialise, demand must withstand again a good number of years at high prices without undershooting.
The successive supply destruction – demand destruction cycles are the key dynamics of peak oil at an yearly scale. These cycles push left and transform each curve in succession, eventually producing a stall in traded volumes and finally a decline. The petroleum market has endured a supply destruction cycle for almost two years now, and while that cycle is clearly closing, it is yet far from the 100+ $/b price required to provide a reversing signal to the industry. With various petroleum exporting nations on the brink – in great measure due to the financial machinations concocted in the US – this supply destruction cycle might have been just too long.
The Take Away
- “Shale oil” is effectively insulated from prices by the US finance industry.
- Present supply destruction cycle is coming to an end.
- After two years of low prices, extraction is set for a multi-year decline.
- New demand destruction cycle to start in the next 18 months, depending on how stocks are managed.
- A return to an extraction rate of 80 Mb/d seems unlikely for the foreseeable future.
- Can it ever return?
15 Comments on "This is Peak Oil"
rockman on Mon, 23rd May 2016 6:45 am
“This means that even bankrupt petroleum companies are still bringing new source rock wells online, only deepening further the present supply destruction cycle.” FYI: bankrupt companies are not bringing anything close to a meaningful number of new wells on because they are BANKRUPT, fool. LOL.
“Shale oil” is effectively insulated from prices by the US finance industry.” Really? You try to borrow capex to drill a shale well from a bank lately, fool? LOL
“Present supply destruction cycle is coming to an end.” Isn’t that completely contradictory to the following statement: “After two years of low prices, extraction is set for a multi-year decline.”
“New demand destruction cycle to start in the next 18 months, depending on how stocks are managed.” This one: I have no idea what they are trying to say.
“A return to an extraction rate of 80 Mb/d seems unlikely for the foreseeable future.” According to the IEA during 1Q 2016 global oil production averaged 96.35 million bopd. It’s been 13 years since production was less than 80 million bopd. When was this written? LOL
Cloud9 on Mon, 23rd May 2016 7:14 am
Both our financial system and our political system were constructed over a hundred years ago during a period of exponential growth. Perpetual growth is absolutely necessary for these two interlocking systems to continue. One of the more interesting questions for me is at what point will the economic and political system be forced into default as a consequence of the end of growth?
Davy on Mon, 23rd May 2016 7:21 am
I have been saying this for a year now and this article hits the nail on the head “The successive supply destruction – demand destruction cycles are the key dynamics of peak oil at a yearly scale”.
We are in a very unnatural and volatile time. We are seeing the new normal of financial control that followed the 08 crisis breaking down. Just look to the US fed, Europe, and China to see all is not well. The global economy is hollow. Real growth seen by trade and real flows of goods is not what the financialization metrics indicate.
Real trumps abstract but it takes time for the denial and manipulation to be exposed. We have a business cycle that has been the second longest upswing on record and it surely is nearing its end. This is not a normal business cycle ending it is a financially controlled one with an abstract market and currency driven cycle.
The real economy stabilized briefly after the 08 crisis but it never recovered to health. The stabilization was nothing more than a huge debt driven malinvestment of overcapacity and unneeded development. Those bills are coming due as we see in China recently with the beginning of its recapitalization of its banks because of nonperforming loans. It is happening in Europe for the same reason. Italian banks are the next tipping point there. It is coming to the US soon with a stock market crash from an obscenely overvalued stock market. These failing financial nodes are going to be further real demand destruction that will expose the overvalued financial markets. We have seen the real economy never recover. We saw the commodity super cycle lead by China stall and die. Now we are going to see the financialization of the global economy gutted by failures.
This is the vicious cycle of demand and supply destruction we call global deflation. We saw the end of the commodity supers cycle especially with the stagnation of the Chinese growth engine and the end of the Fed QE that support the shale bubble. We are seeing global trade plummet as seen with the Baltic Dry Index. We are seeing at the same time supply destruction occurring most noticeably in the all-important oil complex.
Without a healthy oil industry globalism can never be healthy. Forget any substitutions for oil there are none. Forget continued financialization of the global system to mask demand destruction. Debt is now deflation because all that debt has turned into bad debt as debt does that is not productive. The process is now culminating in a demand and supply destructive phase. How long this will last is uncertain but it is an end game. Oil can never recover from a supply drop driven price increase. This is because deflation is firmly in charge. Demand cannot recover because we are in a deflationary spiral from debt and the end of the Chinese growth engine. China demand destruction and debt from China, US, and Europe is the end of globalism. They are converging and combining to create a downward spiral of decay and destructive change.
Davy on Mon, 23rd May 2016 7:26 am
More demand carnage:
http://www.zerohedge.com/news/2016-05-22/eveertyhing-plunging-china-commodity-carnage-continues
onlooker on Mon, 23rd May 2016 7:38 am
But remember along with this deflation and supply/demand destruction eventually will come inflation as excess currency especially dollars will be trying to all purchase necessary items. Oil and some commodities are necessary in certain amounts and once scarcity really gains a foothold expect Stagflations. A stagnant economy along with inflation ie higher prices and/or a devalued currency.
Davy on Mon, 23rd May 2016 8:41 am
Inflation in a deflationary environment is the ingredients for hyperinflation which is basically loss of confidence in fiat currencies and the economy. Since the dollar is the de facto global currency without replacement and which all others are directly or indirectly tied to, this will visit every country not just the US.
shortonoil on Mon, 23rd May 2016 8:47 am
Luis de Sousa has been involved in the Peak Oil debate for a very long time. He wrote an excellent article called Wolf at the Door about a decade ago that had a considerable impact on that discussion. He concludes this article with 5 Take Aways to sum up his conclusions:
1) “Shale oil” is effectively insulated from prices by the US finance industry.”
This is true, but it is a situation which is not likely to persist for much longer. Much of Shale’s market arose to supply the needs of bitumen producers for diluent. Bitumen production is declining, and will continue to do so. The money to finance the Shale industry resulted from the monetary policies of the US FED. This was accomplished through the cannibalization of existing assets. The FED does not print money, only currency. The FED has cannibalized the easy to access money; the bulk of the low hanging fruit is now gone. Their policy of very easy money will have to be restrained in the near future. This will have a significant impact on future Shale production.
2) “Present supply destruction cycle is coming to an end.”
This is not likely to be the case. Supply is reliant on Demand; which is now in perpetual decline. Demand is driven by oil’s ability to supply energy, which is now declining faster than increasing production can compensate. This is explicitly stated by the Etp Model.
3) “After two years of low prices, extraction is set for a multi-year decline.”
Definitely true.
4) “New demand destruction cycle to start in the next 18 months, depending on how stocks are managed.”
The demand destruction cycle started in 2012. It has been papered over by Central Bank policies, which are not long term sustainable. This is likely to become evident over the next 18 months.
5) “A return to an extraction rate of 80 Mb/d seems unlikely for the foreseeable future.”
The energy to increase production to 80 mb/d no longer exists. Unless some fabulous new energy source immediately appears production will not reach 80 mb/d again. The Central Banks massive cannibalization process is coming to its conclusion as assets become ever more difficult to liquidify.
BW Hill
http://www.thehillsgroup.org/
twocats on Mon, 23rd May 2016 2:21 pm
Current shale oil active wells ARE insulated, even from bankruptcy. Drilling and exploration for future production has been cut. So eventually supply will dry up and undertake demand. At that point demand destruction process will recommence in earnest as prices move higher. This is what the article is saying and this fairly accurate.
Boat on Mon, 23rd May 2016 4:08 pm
twocats
Except short claims prices can never rise. Ask him.
shortonoil on Mon, 23rd May 2016 5:05 pm
“Except short claims prices can never rise. Ask him.”
Some people really are dumber than a box of rocks!
What we said, and said, and said, is that prices are now range bound. Here is the graph:
http://www.thehillsgroup.org/depletion2_022.htm
The above, time dependent graph, shows at what price enough demand destruction occurs to bring prices back to the curve. We are stating that for people whose IQ is higher than their shoe size. This is not to be confused for an estimate of the price, it is just its boundary conditions.
Since my dog understands boundary conditions (he pees on 20 bushes each morning to define it) try drinking a lot of water, and go for an early morning walk. The concept will be permanently implanted in your skull.
MSN Fanboy on Mon, 23rd May 2016 7:17 pm
LOL SHORT
You know beyond a certain point they will go cap in hand to the government, WHO WILL NOT LET THEM FAIL.
I bet were all still here and driving by 2030.
Silly Billy
shortonoil on Mon, 23rd May 2016 7:58 pm
“You know beyond a certain point they will go cap in hand to the government, WHO WILL NOT LET THEM FAIL. I bet were all still here and driving by 2030. Silly Billy”
That is exactly what will happen, but they won’t be coming cap in hand from Saudi Arabia. They haven’t got that much oil left. Iraq has already cost the US $4 trillion. What comes after trillion? We haven’t got that much money. We will stand by our original estimate that the US would be operating on 4 to 6 mb/d by 2030.
http://www.thehillsgroup.org/
MSN Fanboy on Tue, 24th May 2016 4:27 am
You actually agree!
Fair Enough, Time will tell.
Davy on Tue, 24th May 2016 6:00 am
This is the economic end game or one of them. China is the global production engine and its demise spells the end of globalism. It is just too big to fail and it is heading for failure.
“Kyle Bass Was Right: SocGen Does The Math On China’s Staggering NPL Problem, Issues Dire Warning”
http://www.zerohedge.com/news/2016-05-23/kyle-bass-was-right-socgen-does-math-chinas-staggering-npl-problem-issues-dire-warni
“In a must read note released by SocGen’s Wei Yao titled “Restructuring China Inc.” the French bank tackles just this topic (and many others). What it finds is disturbing and serves as a confirmation of all recent bearish assessments – most notably that of Kyle Bass – that China’s bad debt problem will end in tears.”
“Here is Yao’s summary: China is still leveraging up rapidly, with its nonfinancial debt up to 250% of GDP [ZH: realistically 350%]. The corporate sector and capital market liberalisation that the authorities are pushing for has begun to destabilise the debt dynamics. The beginning of debt restructuring for SOEs, the biggest borrowers and underperformers, brings closer the prospect of bank restructuring – a scenario we think that has a probability of more than 50% over the medium term.”
“As SOE restructuring progresses, it will also become more apparent that Chinese banks need to be rescued. We estimate that the total losses in the banking sector could reach CNY8 trillion, equivalent to more than 60% of commercial banks’ capital, 50% of fiscal revenues and 12% of GDP. The actual tally may still be years away, but could be more sizeable if problems continue to grow.”
“As SocGen writes next, when it says to “beware of devaluation risk”, one possible source of funding is backed by government bonds, which is effectively a form of QE, and which, as a result of China’s impossible trinity would have an impact on capital flows and the yuan that would be “rather negative.”
“In addition to bank recapitalisation, the government would have to provide fiscal support to address unemployment pain and other social effects. The total fiscal bill would probably be considerably more than 10% of GDP.”
“Another option is for the PBOC to use its vast (if declining) reserve holdings to directly inject funds into the banking system. This approach is less likely….Any conversion would exert appreciation pressure on the Chinese currency versus the dollar (i.e. deflationary).”
“There are two major risks with this gradual approach, in our view: a lost decade and policy uncertainty. The restructuring might be too slow – even slower than the formation of new NPLs. In this case, we would never see deleveraging, and the restructuring bill would only grow – which has been the case in previous years.”
Davy on Tue, 24th May 2016 6:07 am
Demand destruction is in control
“Who Is Right Between Oil And Other Commodities: One Hedge Fund’s Opinion”
http://www.zerohedge.com/news/2016-05-23/who-right-between-oil-and-other-commodities-one-hedge-funds-opinion
“So far in May, base metals and Oil decoupled markedly (chart attached below). While the Oil price kept rising and moved closer to 50$, base metals fell off a cliff and descended below March lows. We believe that Oil is the errant outlier, helped by deep but temporary supply outages in Canada and Nigeria and all-time record speculative flows, and is more likely to catch down to other commodities going forward rather than the other way round. We look at Oil gyrations as short-term heavy volatility, within a long-term downward trend.”
“On the other hand, weakness in commodities is consistent with fundamentals: Weak aggregate demand (likely to stay shallow in the foreseeable future) vis-a-vis chronic global over-supply, China inability to keep expanding credit at current pace and keep creating an illusion of demand the world over (1trn$ or 10% of GDP per quarter is unsustainable), A stronger US Dollar, and the unease of the FED to talk it down, as current account deficit shrinks and only small hikes are priced in”