The Bakken and North Dakota tight oil production data is out.
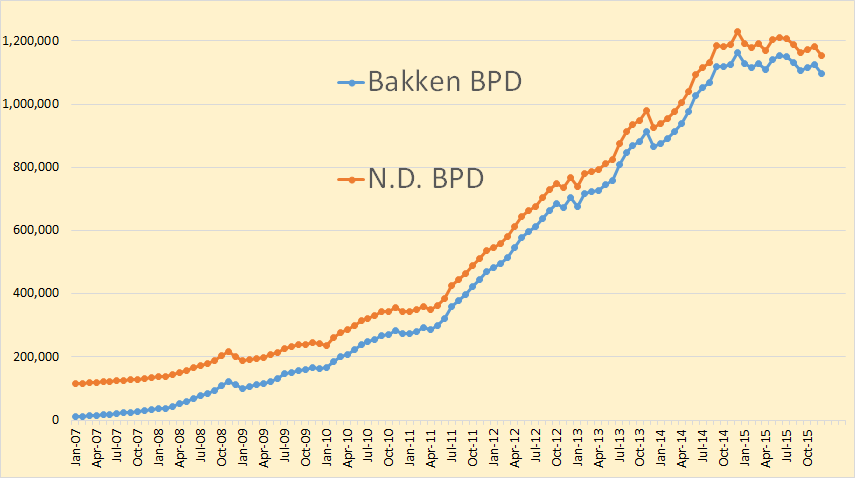
Bakken production was down 28,604 barrels per day to 1,096,044 bpd. All North Dakota was down 29,506 bpd to 1,152,280 bpd.
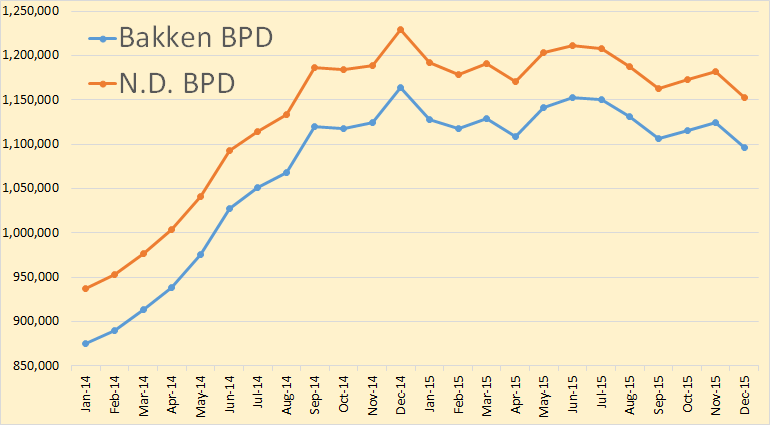
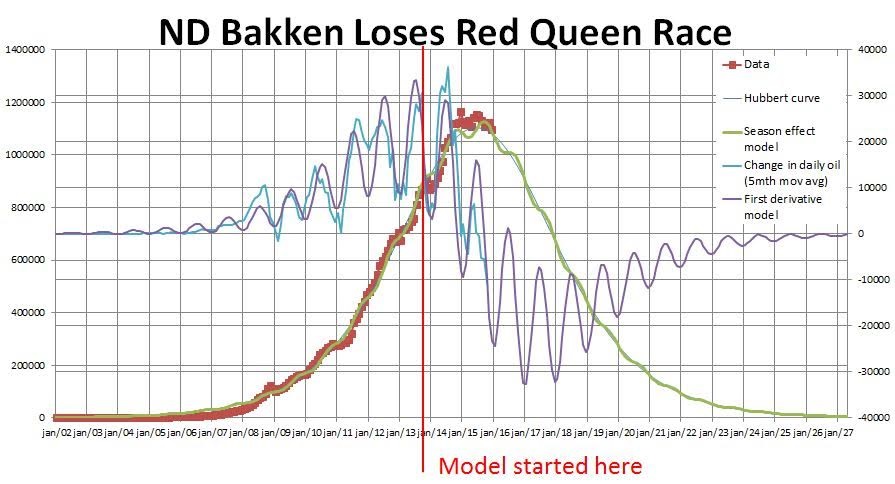
This is just the last two years of the chart above. It gives a slightly better look at what is happening.
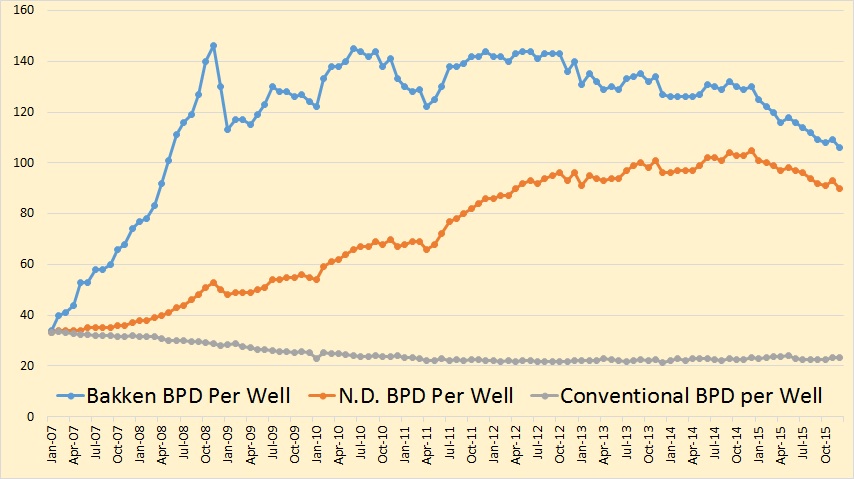
Barrels per day per well fell to 106 in the Bakken and to 90 in all North Dakota.
From the Director’s Cut
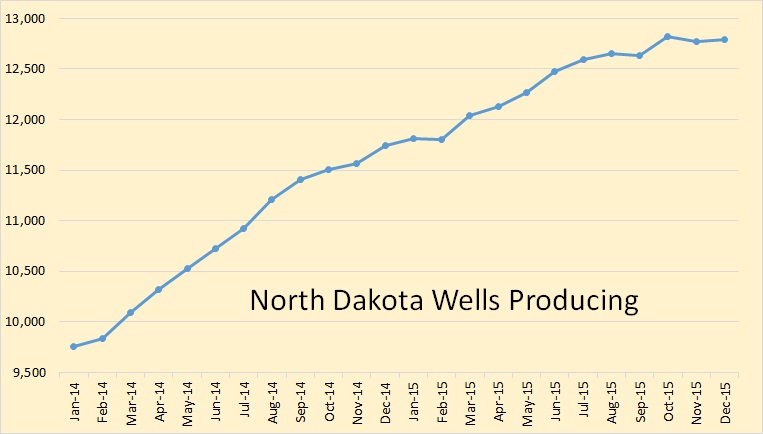
Producing Wells
November 13,100
December 13,119 (preliminary)(all time high was Oct 2015 13,190)
10,756 wells or 82% are now unconventional Bakken–Three forks wells
2,363 wells or 18% produce from legacy conventional pools.
–
Permitting
November 125 drilling and 0 seismic
December 95 drilling and 0 seismic
January 78 drilling and 0 seismic (all time high was 370 in 10/2012)
–
ND Sweet Crude Price
November $32.16/barrel
December $27.57/barrel
January $21.13/barrel
Today’s $16.50/barrel
(lowest since February 2002)(all-time high was $136.29 7/3/2008)
–
Rig Count
November 64
December 64
January 52
Today’s rig count is 41 (lowest since July 2009 when it was 40)(all-time high was 218 on 5/29/2012)
The statewide rig count is down 81% from the high and in the five most active counties rig count is down as follows:
Divide -85% (high was 3/2013)
Dunn -76% (high was 6/2012)
McKenzie -75% (high was 1/2014)
Mountrail -88% (high was 6/2011)
Williams -90% (high was 10/2014)
–
Comments:
The drilling rig count was steady from November to December, fell sharply from December to January, and again into this month. Operators are now even more committed to running fewer rigs as oil prices remain at very low levels. The number of well completions remained steady from 77(final) in November to 76(preliminary) in December. Oil price weakness is now anticipated to last into at least the third quarter of this year and is the main reason for the continued slow-down. There were no significant precipitation events, 5 days with wind speeds in excess of 35 mph (too high for completion work), and 2 days in Williston with temperatures below -10F.
Over 97% of drilling now targets the Bakken and Three Forks formations.
At the end of December there were an estimated 945 wells waiting on completion services2, 24 less than at the end of November.
Crude oil take away capacity remains dependent on rail deliveries to coastal refineries to remain adequate.
The drop in oil price associated with anticipation of lifting sanctions on Iran and a weaker economy in China is expected to lead to further cuts in the drilling rig count. Utilization rate for rigs capable of 20,000+ feet is about 30% and for shallow well rigs (7,000 feet or less) about 20%.
Drilling permit activity declined November to December then fell further in January as operators continue to position themselves for low 2016 price scenarios. Operators have a significant permit inventory should a return to the drilling price point occur in the next 12 months.
Bruno Verwimp posts me the above chart. He says so far the Bakken is following his curve exactly.

Plantagenet on Wed, 17th Feb 2016 7:42 pm
Good to see TOS production finally starting to decline. Of course these small declines are already offset by new exports from Iran, so the oil glut is still depressing oil prices in global markets.
Nony on Wed, 17th Feb 2016 8:12 pm
As usual his charts are not zero based which just makes declines seem bigger than they really are. If the charts were zero based you’d hardly even be able to see the decline unless the chart was really really big. This flaw in presentation renders the data meaningless. USA could produce 20 million barrels a day easy.
Nony on Wed, 17th Feb 2016 8:37 pm
This is amazing, peak Nony. You are doing a great job of emulating me.
Oh…except for the 20MM part, doesn’t follow.
I was actually not going to do the zero based crit. Was going to post a youtube of the Wicked Witch of the West screaming that her wickedness was melting after Dorothy splashed her.
Still freaks me out a little. How about distributing the love and aping a few more of the posters?
-real Nony
JuanP on Wed, 17th Feb 2016 8:44 pm
Nony, It is precisely to be able to see details that the graphs are not zero based, and you should know that. This data presentation is flawless. I can understand it perfectly well, and so should you. It seems completely clear to me. Do you know anything about graphing? Your argument is completely moronic. Please try to come up with something better to say next time.
Nony on Wed, 17th Feb 2016 8:46 pm
I didn’t say it this time. It was the guy aping me. 🙁
He wants to drive me off the boards so you only have true believers here. No vexing opposite viewpoints
JuanP on Wed, 17th Feb 2016 8:49 pm
Nony, I don’t know if that is for real or not, but if it is, it is a very dirty trick. We are all entitled to our opinions. Keep up the fight!
Nony on Wed, 17th Feb 2016 8:56 pm
JuanP:
Like I said, before. You are my favorite peaker. We are far apart on politics, but you have a very cool air about you. Kindness, maybe. I bet you are well liked in real life too.
Anyhow, we will never agree on politics or football teams. But thanks, man.
Nony on Wed, 17th Feb 2016 9:54 pm
JuanP:
We should get together sometime. I bet you’re cute 🙂
Apneaman on Wed, 17th Feb 2016 10:08 pm
Looks like the troll is getting trolled. Maybe think of that while you’re clinging to life on an arctic with all the other apes and cancer monkeys.
Apneaman on Wed, 17th Feb 2016 10:32 pm
Fuck off using my handle fuctard
Nony on Wed, 17th Feb 2016 10:34 pm
I suck big black cock and swallow!
Nony on Wed, 17th Feb 2016 10:35 pm
Check it out! 25 comments in this article!! 19 of them are mine!!!
http://oilpeakclimate.blogspot.ca/2015/07/oil-shock-models-with-different.html?m=1
-real Nony
twocats on Wed, 17th Feb 2016 11:10 pm
Yeah it’s going down, but that is one slow ass trend – 8% in the last year. Will these types of drops be enough to offset the overhang? 3rd or 4th quarter of 2016 seems to be a growing consensus.
The two interesting trends: bpd per well starting right around the end of 2014. Does that mean they aren’t moving the “pump rigs” around as much to save cash? Or does anyone think that’s secular?
The other is the prices paid January and Today. that’s just wow.
As for the “red queen” chart, i mean sure he got lucky on the timing, but there will almost certainly be a secondary peak somewhere in ’17 or ’18. Even Ron doesn’t believe that chart,
“Operators have a significant permit inventory should a return to the drilling price point occur in the next 12 months.”
these are the charts that I tend to discount at this point. Too many external factors in my opinion.
Nony on Thu, 18th Feb 2016 4:00 am
I like chicken I like liver
meow mix meow mix please deliver
peakyeast on Thu, 18th Feb 2016 5:31 am
Looks like apeman also has been hijacked.
Not one link from him, but several posts. Seems very atypical.
Apneaman on Thu, 18th Feb 2016 5:44 am
Here’s the New Study the Fracking Industry Doesn’t Want You to See
“Each day, oil and gas producers generate 2 billion gallons of wastewater,” Duke Professor Rob Jackson stated, as Business Insider reported. Though the disposal site near Blacklick Creek has since ostensibly agreed to stop storing or treating Marcellus Shale fracking waste, the industry is far from clean — or transparent.
“They produce more wastewater than hydrocarbons,” said Jackson of the natural gas industry. “That’s the broader implication of [the Duke] study. We have to do something with this wastewater.”
Considering the Marcellus Shale study and the now-proven cancer link, fracking wastewater just became enormously important to millions of people living near thousands of wells in the United States, as well as other countries.
As the Downstream Strategies researchers found, due to lack of regulatory reporting requirements for the fracking industry — aided greatly by its exemption from the Safe Drinking Water Act by law in 2005 — “the fate of 62 percent of fracking waste is unknown.”
http://theantimedia.org/heres-new-study-fracking-industry-doesnt-want-see/
rockman on Thu, 18th Feb 2016 7:41 am
“Each day, oil and gas producers generate 2 billion gallons of wastewater,” Wow! What a great defender of the environment. LOL. Rob doesn’t have a clue about the real magnitude of the situation. He claims 47 million bbls of “waste water” in generated every day. Texas alone has 34,200 active injection wells. That would equate to about 1,400 bbls per day per injection well IF ALL THE DISPOSAL were happening in Texas. I know of INDIVIDUAL FIELDS (let alone the entire state) that are injecting 50X that average amount every day. BTW: 99.9% of that waste water is just salt water with no frac’ng chemicals involved. For the last 100 years many TRILLIONS OF BBLS of “waste water” have been injected by the oil patch. In fact much more frac fluid has been injected over the decades prior to the “shale revolution” then in the last 10 years. So many folks think that frac’ng is some new tech and don’t understand its been going on for more then 6 decades. And that doesn’t include the TRILLIONS OF BBLS of much more toxic compounds from other industrial sources that have been pumped down disposal wells.
If one wants to be an alarmist they should really dig up the actual numbers. LOL.
Kenz300 on Thu, 18th Feb 2016 9:55 am
The fossil fuel industry continues to pollute the air, land and water we all need to survive.
It is time to speed up the transition to safer, cleaner and cheaper alternative energy sources.
Climate Change is real……we need to deal with the cause (fossil fuels)
100% electric transportation and 100% solar by 2030
https://www.youtube.com/watch?v=RBkND76J91k
GregT on Thu, 18th Feb 2016 11:35 pm
Electric transportation also pollutes the air, land and water that we all need to survive Kenz.
Climate change is real. Dealing with the cause (fossil fuels) includes the end of modern industrialism, and all electric power generation.
Apneaman on Thu, 18th Feb 2016 11:59 pm
Kenz, what do you do for a living? I’m guessing you have never been on the tools and don’t really know anything about machines or industry of any sort. I’m betting all your information come from feel good green weenies you read in Alternet articles and asshole academics in suits like in your stupid fucking video.
Here is my video of a wind turbine base being built and the turbine being erected. As someone who is a professional rigger, I can tell you that the cranes are all diesel powered and are transported to the site with diesel power. Same for all the excavators and cement trucks, etc,etc. There are no alternatives. The on site electricity and compressed air is all produced by diesel generators too. Remember this is just the erection phase. The mining and manufacturing phase is even more fossil fuel intense.
MidAmerican Energy Company – From the Ground Up: Building our energy future, one turbine at a time
https://www.youtube.com/watch?v=84BeVq2Jm88&app=desktop
Don’t kid yourself kenny boy. This is industry and has it’s own massive toxic waste stream like all industry. I’m all for building it while society can, but lets please stop pretending that it’s going to make one damn bit of difference as far as AGW is concerned. It will most definitely contribute a great share to the ongoing and increasing habitat destruction AKA – the 6th mass extinction. Too many privileged westerners with massive ecological foot prints kenny. 1 American equals 30 Africans. America = 5% of global population, but uses 30% of the world’s resources. Can’t green that dip shit.