Peak Oil is You

Donate Bitcoins ;-) or Paypal :-)
Page added on December 8, 2015
Why Oil Is About to Start a Huge, Multi-Month Rally

As often happens after large degree trends reach maturity, the crowd becomes fully associated with the what has happened, and misses the next great opportunity. This exact scenario is not only occurring in crude, again (as it did at the low of one lesser trend degree at the 2009 low, but also happened at the 2008 peak, 2011 peak, 2011 low, and 2013 peak), into the current price and time windows.
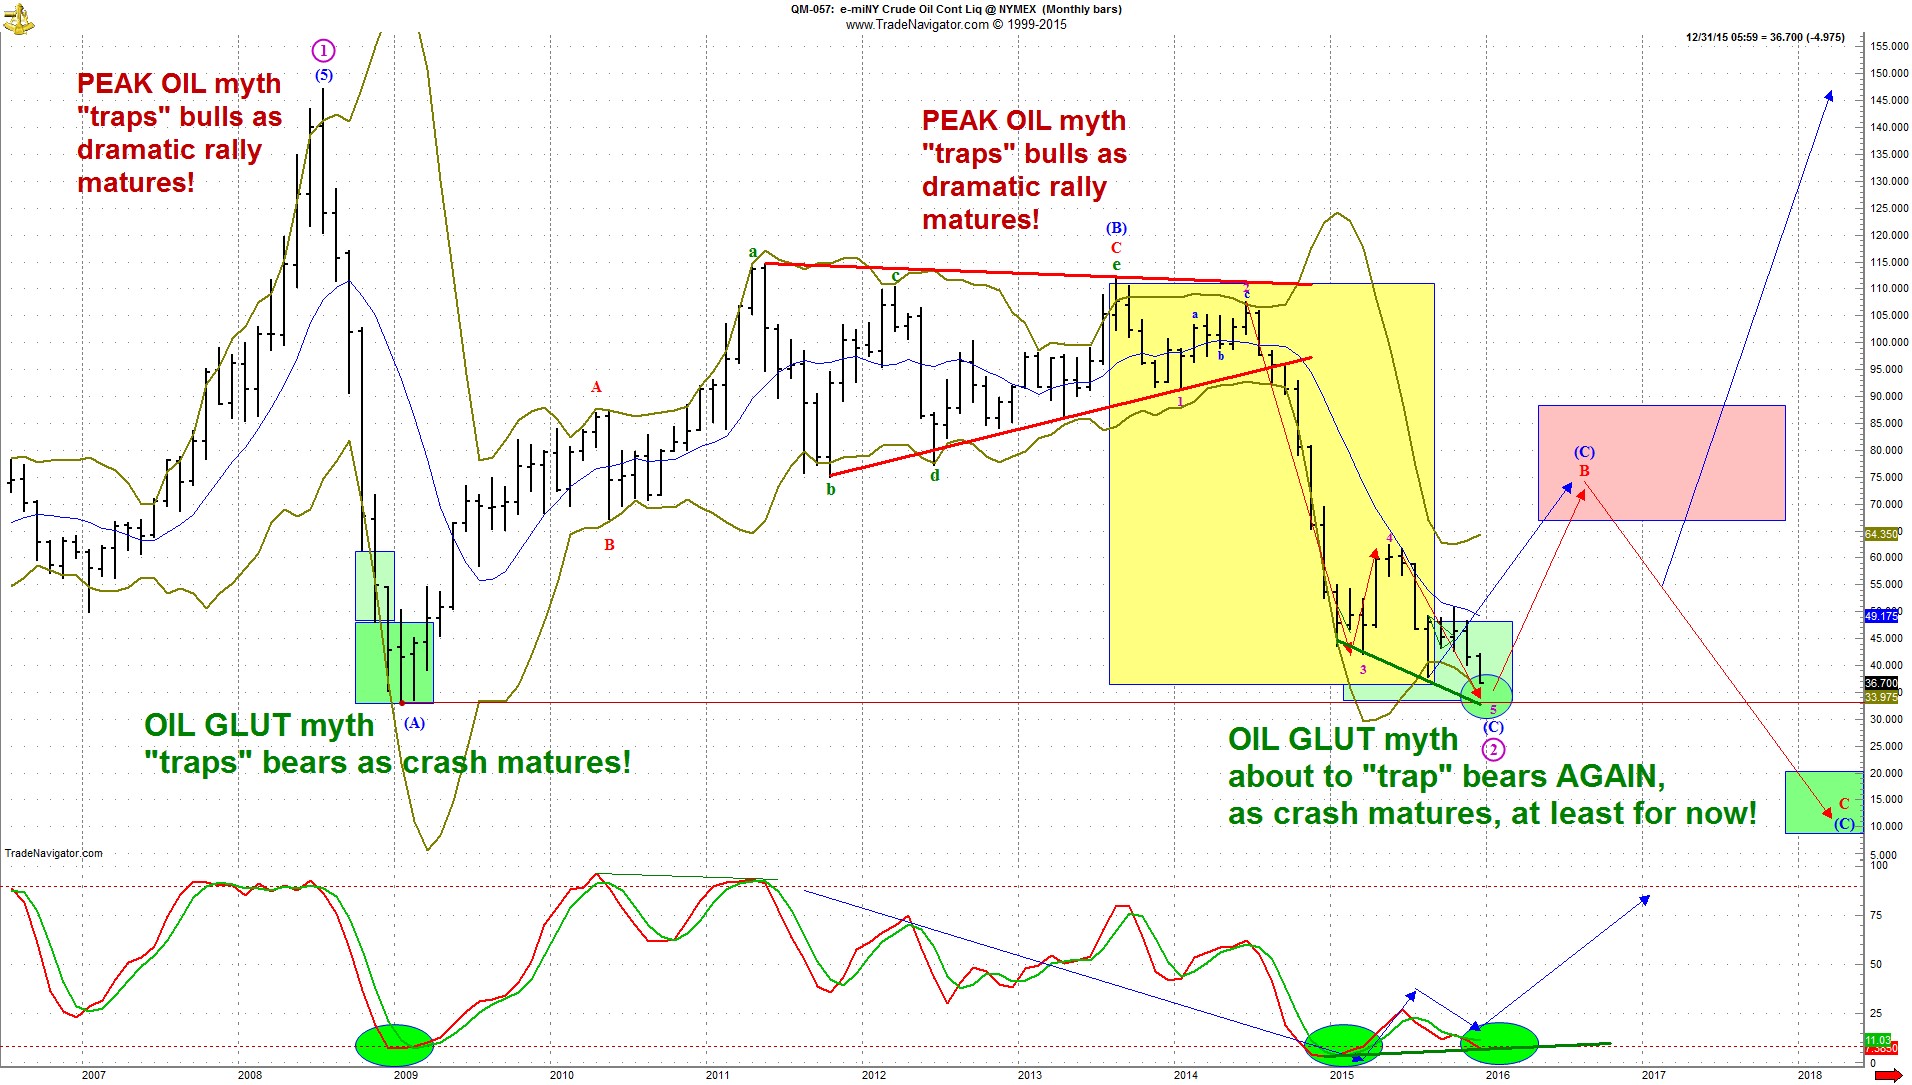
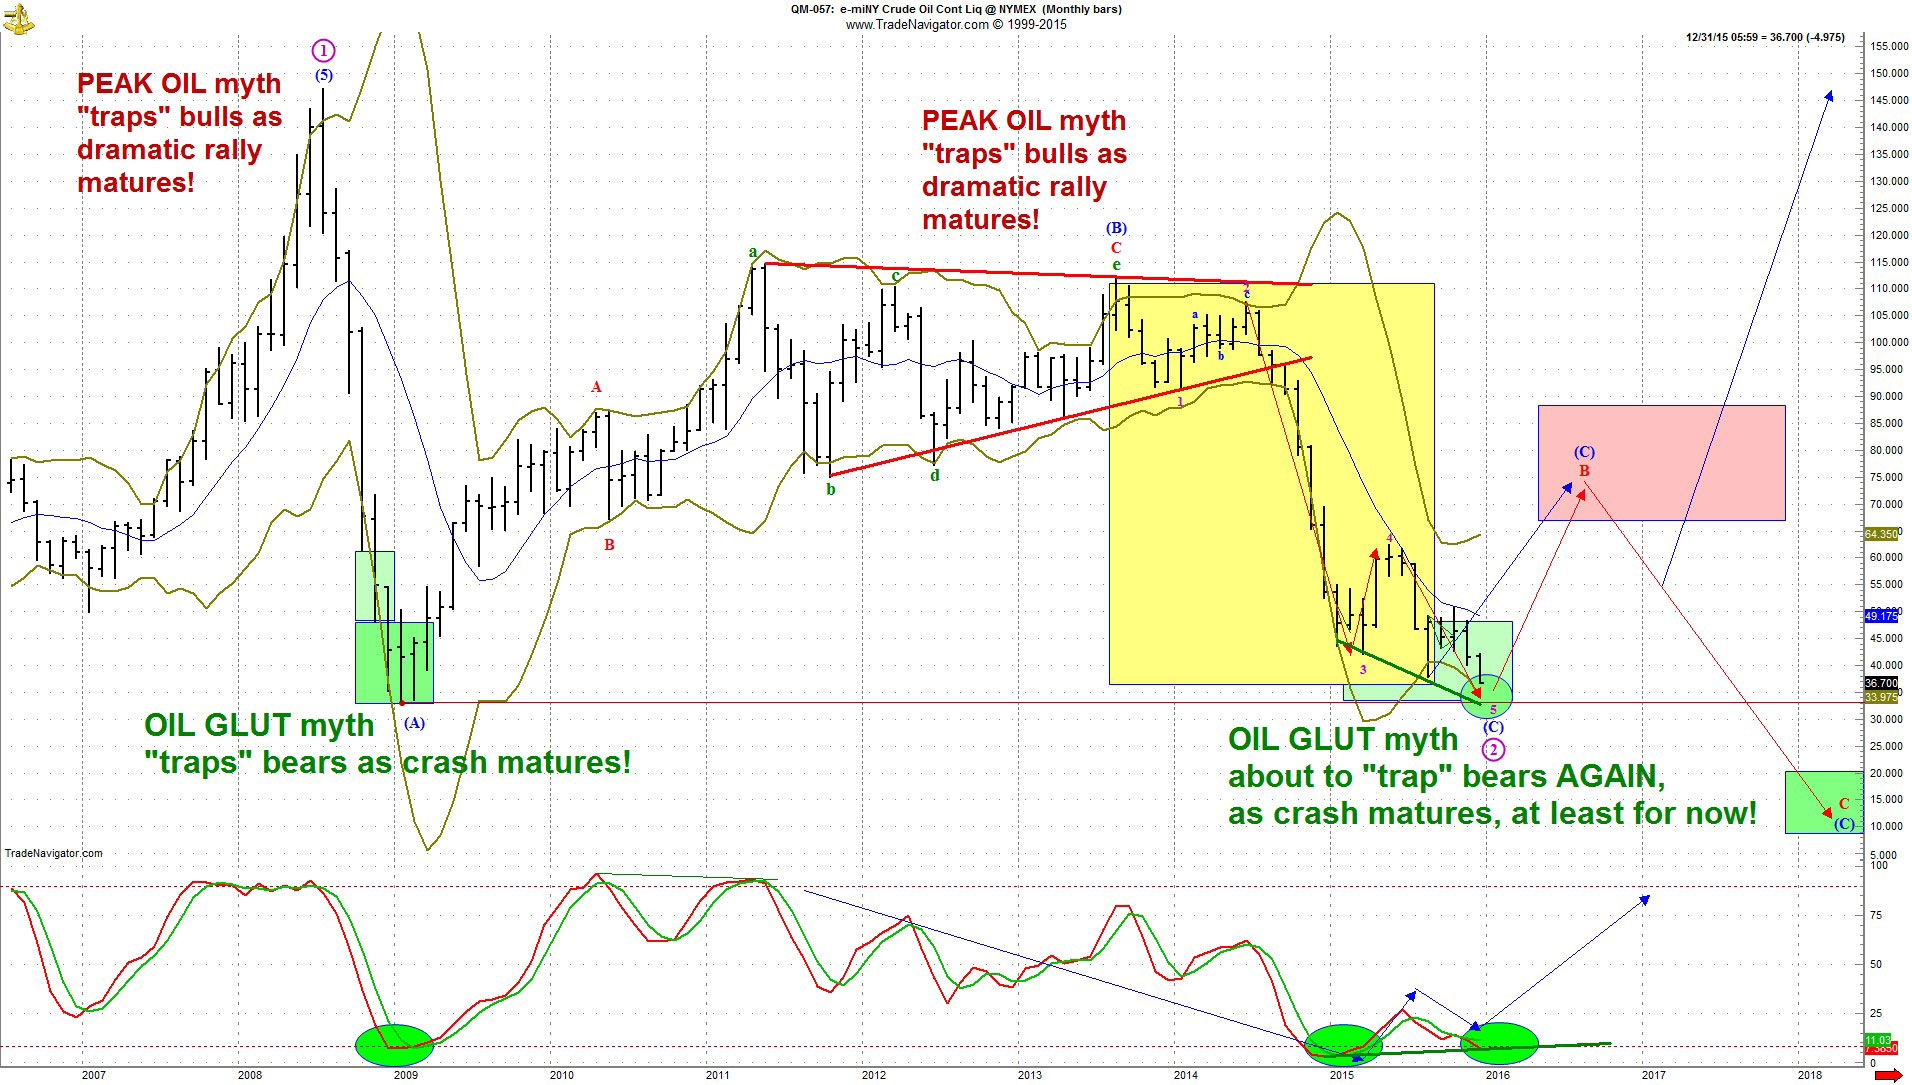
The rationale back then was the oil glut paradigm, where the world was drowning in crude. Interestingly, as the monthly bar chart below notates (into the 2008 parabolic price rise), this glut story came to the headlines within only six months of the story that was being attached to the crude price rise from $50 to $137; the peak oil paradigm. This was the premise that every last drop of oil on the planet has been identified, and the moment in time the world would run out of oil could be calculated (given the population growth and usage assumptions, etc.).
Click here to see the below chart in a new window
Like any pendulum swing from one extreme to the other, wild price movements in the oil market are moving from one (sentiment) extreme to the opposite.
What really caused the run into the 2008 all-time high had nothing to do with counting oil droplets or barrels, nor did any other high or low since OPEC lost control of global oil pricing, arguably around the turn of the century. The cause of these moves are liquidity (of cash, not crude), leverage, and sentiment; mostly of hedge funds and professional trading firms that tend to become fully associated with their positions, known in the industry as “talking their book,” at the time when objectivity is needed most.
When viewed from a pattern recognition perspective, which is one of the algorithms that our objective decision support engine (DSE) uses to identify high probability trend inflections and forecasts, the news noise quiets, and the picture becomes clear and usable. For example, if you use our super simple six-foot analysis technique, employed by moving your eyeballs six feet back from your screen, one notices that the 2008 peak can be labeled as wave 1-circled, representing the highest high in history. This is also when the crowd developed the most bullish sentiment extreme ever recorded, and created the most bullish story one could hope to apply to a commodity; crude supplies are now provable to be finite, and demand infinite! As typically happens at this pole in the pendulum’s swing (the moment in time when the direction is about to change, and the pendulum freezes in space), prices hit the upper 3 standard deviation band (containing 99.7% of normality), and have no where to go but down. Ralph Elliott proposed that parabolic rises always end in crashes return to, or below, the origin of the parabola’s beginning. As the chart shows, it took less than four months from the peak for the price to reach the $50 origin, then two more months for the ultimate low to be put in. That is labeled as wave (A) of wave 2-circled; the first corrective wave of a three wave correction, to be eventually labeled as (A) down, (B) up, and (C) down, concluding the entire corrective wave 2-circled, ending the crude market’s reset of the bullish extremes that manifested the $137 peak.
The 2013 peak, also using the six-foot technique, is labeled as wave (B), the intervening up portion of the down/up/down corrective pattern. From that peak, there is now a textbook five wave impulsive decline, which is expected for wave (C). Within wave purple 5, the decline from the May peak this year, there are now five smaller waves that can be counted as complete, or nearly so, which is also expected, textbook behavior. In doing so, the crowd has now manifested itself into a sentiment extreme of certainty about the future price of oil that leaves no room for human failure,an attribute of human nature that is impossible to eliminate. Therefore, devastating surprise is about to be brought to the crowd’s certainty, and the next great bear trap, like that of early 2009, is about to slam shut on greedy shorts that refuse to use protective buy stop orders to lock in their amazing profits, and late-joining shorts that missed most of the decline from at least the May peak, near $62, if not the 2013 peak, near $112!
Notice the subtlety of the slightly higher stochastics low occurring now vs. the lower low at the March low, compared to the lower low in prices now vs. then (bold green lines at the bottoms of both panes). This is called a bullish divergence buy signal, and is another condition that our DSE’s hunter/seeker algorithms scan for, and alert when they appear. Viola! If you zoom in, using the link above the chart, you can see that price is now testing the lower 2 standard deviation band, which contains 95% of normality. On daily bar charts (not shown here), this morning’s low tested it perfectly, at $36.45, and reversed. Also on daily bar charts, price is below the lower Bollinger Band, a shorter term measure of extremes of price departure from the zone of typical price action.
As this picture, and the technicals, shows, and the DSE question “if I had no money in the oil market, would buying or selling actions be objectively indicated?” answers, selling actions are NOT indicated below $40. In fact, buying actions ARE indicated, as the blue and red arrows, from our green oval, both point toward a multi month rise into the red box. That zone is 77 +/- 10. This is the forecast of objectivity vs. the forecast of subjectivity (benefiting one’s aging short exposure) of $30, or even those who propose $20.
DSE strongly suggests using $40-$43 as your buy stops on short crude exposure, and considering beginning to establish long crude exposure anywhere in the $30’s, then adding upon a close above $44, to benefit from the next 12-to-18 months of crude rise into the target zone in the pink box.
Don’t let the bear trap get a hold of you. If you want to get a feeling for what that might feel like, imagine shorting crude at $37 in early 2009, thinking you were on the right side of the trade, as price fell to the low of $33, not exiting to take your $4 profit, then dealing with your subjective rationale as price exploded from $33 to the first big reversal point at the 2010 high near $87. Yes, those that were trapped recall it well.
11 Comments on "Why Oil Is About to Start a Huge, Multi-Month Rally"
bs on Tue, 8th Dec 2015 6:55 pm
It is not just the analytics that suggest a big change in crude prices. The supply reports from US shale have declined for 4 months. That will accelerate.
Increasing demand and decreasing supply will cause a shift in the pricing.
twocats on Tue, 8th Dec 2015 7:07 pm
just the way he describes peak oil shows you this guy is full of it and the analysis goes downhill from there. Technical economic analysis has been widely mocked for the last ten years.
makati1 on Tue, 8th Dec 2015 8:57 pm
“The Past is no indication of the Future”.
Boat on Tue, 8th Dec 2015 10:08 pm
mak,
Sorry to say wrong again. The oil is in the ground. Has been for some time. Humans cause the turmoil/wars/markets/peace that slow down and speed up it’s extraction. Good or bad the past has always told us exactly that.
GregT on Tue, 8th Dec 2015 10:56 pm
Exactly correct mak.
Just like the atypical market investment caveat; “Past performance is no guarantee of future results.”
Boat obviously hasn’t been able to figure that one out yet either.
makati1 on Wed, 9th Dec 2015 4:00 am
Boat, Yep, the oil is in the ground. That is a fact. But the recovery of that oil is not certain, no matter what you read or think or the current ‘price’ of oil might be.
The ocean contains more gold than has ever been mined in man’s history, so why isn’t it being mined? Answer: Energy/investment to do so is not profitable. It would take more energy/investment than it is worth on the market.
Oil is the same. We are fast approaching the point where the energy gained is equal to or less than the energy at the use point. Somewhere around 6:1 the Age of Petroleum will end. Not because it has no value but because it would be economically unprofitable. It would be an energy loss, not gain. If it took two barrels of oil to get one out of the ground and to the pumps, would that be intelligent?
No amount of argument can change physics just as no amount of denial can change ‘Mother Nature’ and Climate Change. Both work on natural laws, not wishes.
Dredd on Wed, 9th Dec 2015 4:50 am
Oil will always be a poison fit for omnicide (Questionable “Scientific” Papers – 2).
rockman on Wed, 9th Dec 2015 7:31 am
I gather the writer doesn’t understand that neither the oil producers nor the “bulls and bears” set the price that actual physical oil sells for. The buyers (the refiners for the most part) set the price. The producers can’t force the refiners to pay more for oil then those companies predict they can make a profit from oil purchase at any particular price. The analysts at the refineries make their projections on what they anticipate the consumer market will pay. If they don’t predict consumers will by enough product at a certain oil price for them to be profitable they won’t pay that price. It ain’t rocket science: if a widget maker expects he can only sell enough at $1 to make a profit he isn’t going to pay $1.50 for the components he needs to make one widget.
The only control the oil producers have is how much they’ll sell. Which is exactly why the KSA has increased production: given the buyers/refineries won’t pay a higher price the only way any producer can increase its revenue is to produce more oil. If the US weren’t producing 1 bbl of oil from the shales and the refiners still couldn’t project a profit by paying more than $45/bbl they aren’t going to pay more than $45/bbl. It really is that simple. No different today than in 1998 when the inflation adjusted price of oil was only $17.26/bbl…a decade before the first horizontal shale well was drilled and frac’d. In 1998 the refiners couldn’t pay $20/bbl for oil and make enough profit…so they didn’t.
Ralph on Wed, 9th Dec 2015 8:08 am
Over at peakoilbarrel the numbers are in and it looks like US shale oil production is declining at an annualised
rate of about 20% – which seems to match expectations for a 50%+ decline in drilling and a 40%+ initial decline rate for wells.
Global supply seems to still exceed demand by about 1Mbpd and global supply is still bumping along near peak. Storage is getting tight hence the continued fall in price to boost demand. Even when demand exceeds supply it is going to take many months to drain the stored oil and significantly raise prices, by which time several Mbpd of supply decline will be baked in.
Prices will rocket – but when, I don’t know.
Davy on Wed, 9th Dec 2015 9:25 am
What will happen once prices rocket? I am not sure they will because economic demand in general is unhealthy but let us say they will.
Oil cannot decouple completely from general economic activity. To some extent oil is special because the global economy is oil driven. A significant amount of people have to drive to survive. People drive for other reasons besides economic ones. Goods must be moved by oil in general. These issues cloud our data.
I see high oil prices as a further global currency and market distortion. This would be similar to a fed rate hike or negative QE. The economy is already deflating. Higher oil prices will slow demand further adding to already serious deflationary pressures. I do think prices could go up some to bring the oil complex and the economy more into balance. Currently prices are too low causing their own set of problems.
Kenz300 on Wed, 9th Dec 2015 9:58 am
Banks have stopped lending………past borrowings are now due…….
If It Owns a Well or a Mine, It’s Probably in Trouble
http://www.nytimes.com/2015/12/09/business/anglo-american-to-cut-85000-jobs-amid-commodity-slump.html?emc=edit_th_20151209&nl=todaysheadlines&nlid=21372621&_r=0
——————
Oklahoma Earthquakes: Bombshell Doc Reveals Big Oil’s Tight Grip on Politicians and Scientists
http://ecowatch.com/2015/12/09/earthquake-state/