Peak Oil is You

Donate Bitcoins ;-) or Paypal :-)
Page added on October 6, 2015
Supply, Demand, and the Price of Oil

Could the price of oil be a value such that the current quantity produced exceeds the current quantity consumed? The answer is yes, and indeed that has been the case for much of the past year.
Suppose for illustration that even at a price of $40, there would be enough producers with sunk costs on projects already begun who would be willing to bring sufficient oil to the market to fully meet current consumption. But suppose further that at a price of $40, few new investments are undertaken, so that next year supply is much lower than it is this year, such that next year’s production would equal next year’s demand at a price of $60.
What’s wrong with this picture? Under the above scenario, if you were to buy oil today at $40, store it for a year, and sell it next year for $60, you’d make a huge profit. And if right-minded capitalists tried to do exactly that in huge volumes, the price of oil today would be bid up above $40, as the inventory demand is added to current consumption demand. As that oil is sold next year, it would bring the price next year below $60. In equilibrium, the difference between this year’s price and next year’s expected price should be close to the storage cost.
That arbitrage is clearly an important aspect of what has been going on over the last year. In response to lower prices, capital expenditures in the oil patch are being slashed. The number of drilling rigs active in the U.S. areas associated with tight oil production is only 43% of its level a year ago.
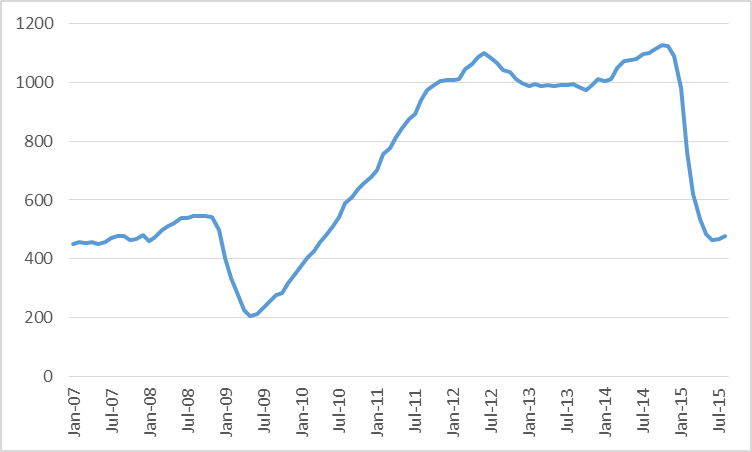
Number of active oil rigs in counties associated with the Permian, Eagle Ford, Bakken, and Niobrara plays, monthly Jan 2007 to Aug 2015. Data source: EIA Drilling Productivity Report.
U.S. oil production is falling, though so far the decline in production has been relatively modest. U.S. tight oil production is only down about 7% from a year ago.
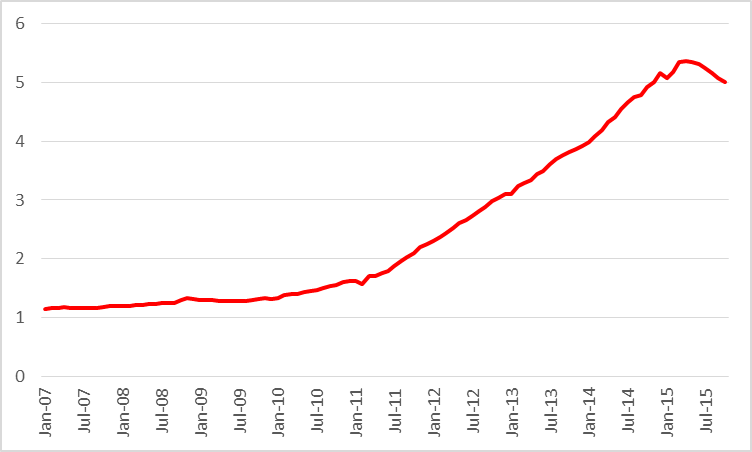
Actual or expected average daily production (in million barrels per day) from counties associated with the Permian, Eagle Ford, Bakken, and Niobrara plays, monthly Jan 2007 to Oct 2015. Data source: EIA Drilling Productivity Report.
If current lower investment results in lower future production, the arbitrage forces described above would mean the current excess supply would go into inventories, which would then be gradually drawn down as field production declines. And that seems to be what we have observed.
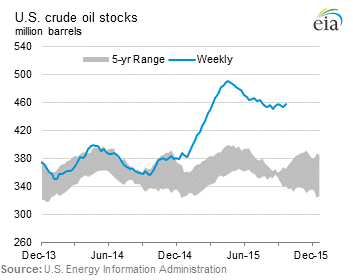
Source: EIA This Week in Petroleum.
The key factor determining whether those inventories will indeed be sold at a higher price than they were purchased is the strength of next year’s demand. So far China’s oil imports have been quite strong.
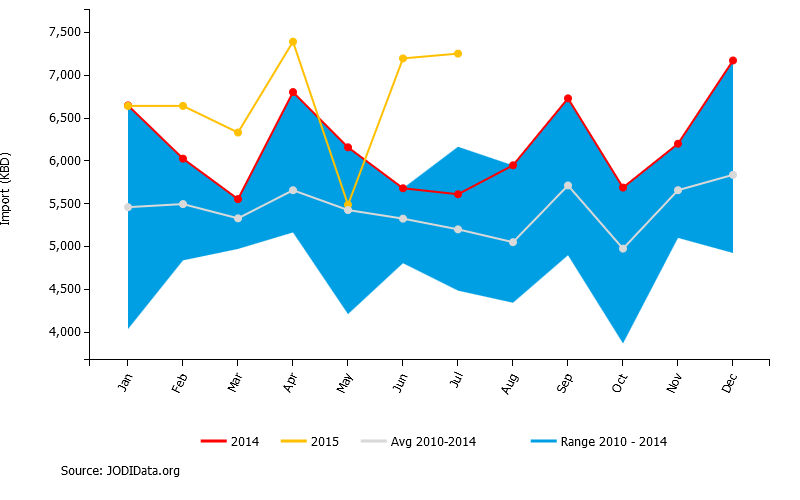
China crude oil imports, thousand barrels per day, in 2015 (yellow), 2014 (red), and range over 2010-2014 (shaded). Source: JODI.
But there is considerable doubt about whether that will continue into next year. For example, manufacturing purchasing managers’ indexes for China are signaling contraction.
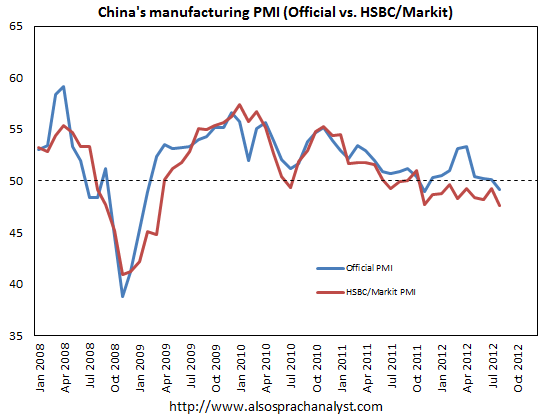
Source: FT Alphaville
What evidence is there that worries about a global economic slowdown are figuring prominently in recent oil prices? Exhibit one is the remarkable comovement between commodity and asset prices. Concerns about global economic weakness show up in commodity prices and asset markets across the board. Art Berman notes the striking visual similarity of graphs for prices of different commodities.
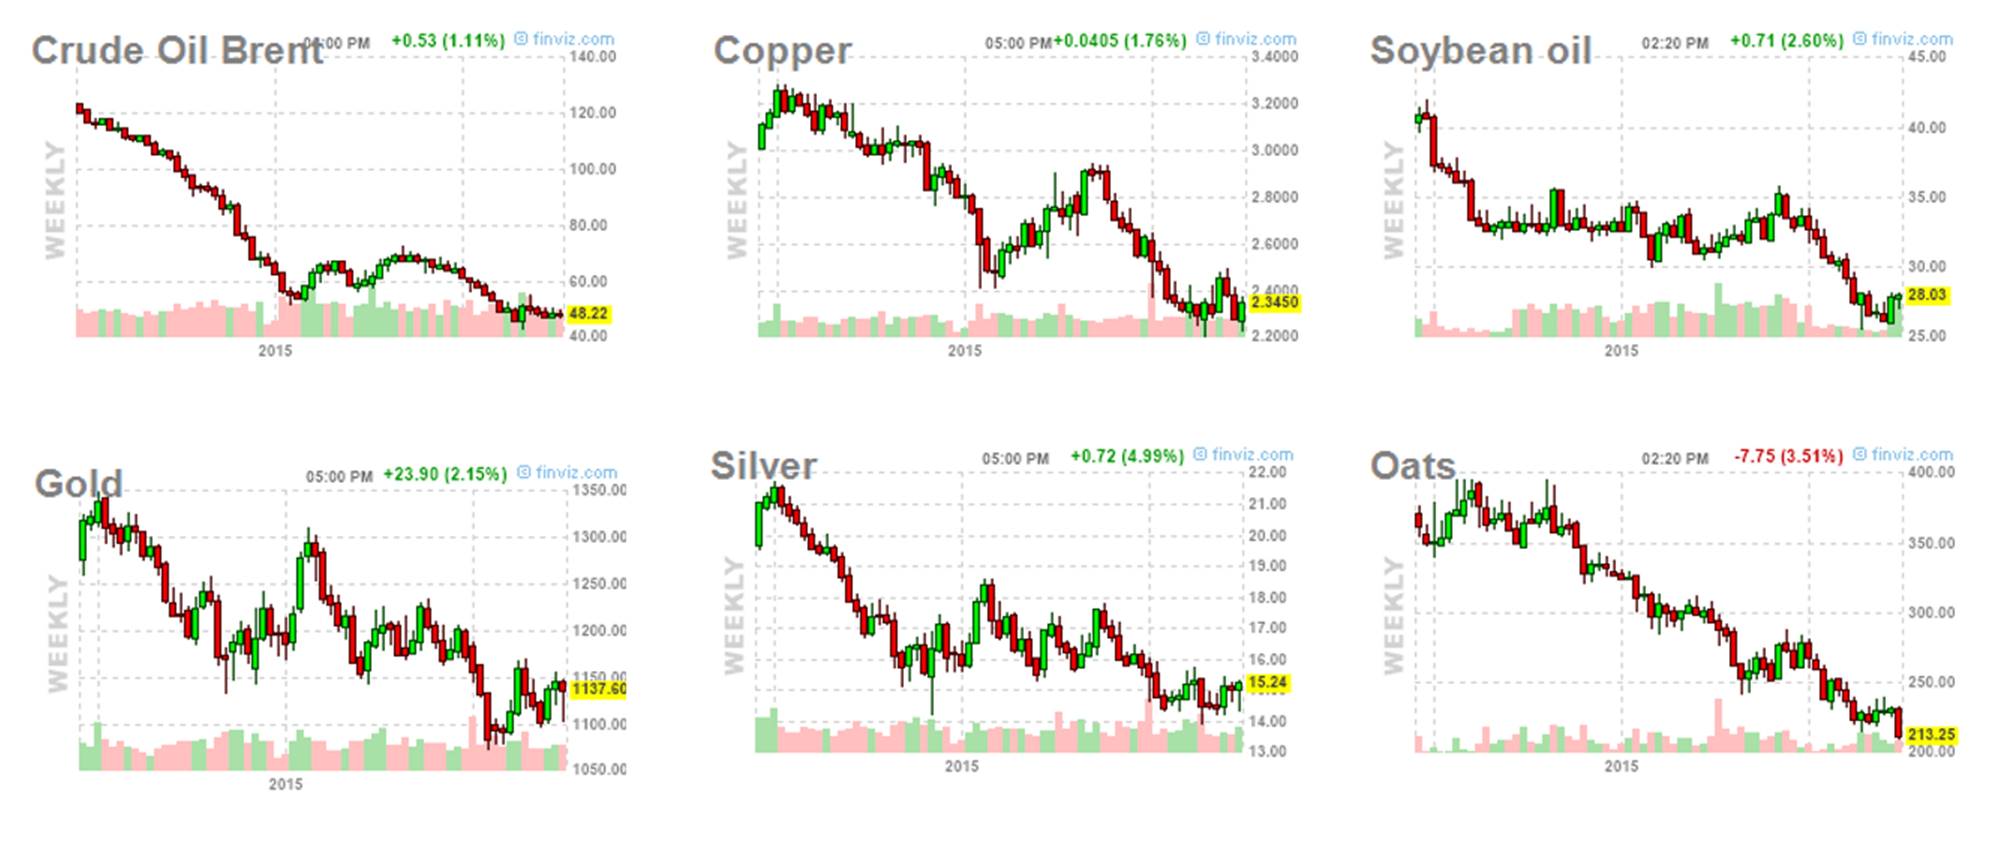
Source: finviz.
Of course, there are other wildcards as well. Most prominent among these is whether there will be enough stability in places like Iran, Iraq, and Libya to permit an increase in production from these and other OPEC producers. But one key given is that U.S. producers will be the primary balancing factor in the current equation, to offset whatever ends up happening with China and OPEC. And the other given is that U.S. production cannot be sustained at current prices.
2 Comments on "Supply, Demand, and the Price of Oil"
makati1 on Tue, 6th Oct 2015 9:20 pm
Another numbers game.
BC on Wed, 7th Oct 2015 11:45 am
Forgive the cross-posting from other threads, but I wanted to catch some of the newcomers.
https://app.box.com/s/8f0rm31psk7thwtd5j3gwgrtx8acmo8t
https://app.box.com/s/ys8ijadj4b57nb95ka0b3ilph38ga7fm
https://app.box.com/s/x61sqtg4c3vp1ubo67k8715ulapw35me
https://app.box.com/s/894h3w9iool3d07cnadqa21tmg89xu8n
Oil is “cheaper”, but it still ain’t “cheap” WRT to the economy’s capacity to grow at current oil prices and supply.
https://app.box.com/s/s0wyvm4xh7kvd4fxcwyxx3mfevtf8yub
And US oil is still being depleted per capita at a steady, log-linear rate (falling 50% per capita by no later than the early 2020s).
https://app.box.com/s/dt2c8mz6vgrq11q8p8i5tbkn3oqlckcb
https://app.box.com/s/6aju2cctaq9wxck2y6xwxdfbqidq95op
https://app.box.com/s/u3icgvx6wbcddnijynhx257dshzm1dyr
Rigs are contracting with the oil cycle, and production will eventually follow.