Peak Oil is You

Donate Bitcoins ;-) or Paypal :-)
Page added on August 18, 2015
Peak of Gas Production in the Barnett Shale

An ocean of ink has already been spilled on pros and cons of using Hubbert curves to model production from a large collection of wells in one or many reservoirs. In 2010, I published together with my last graduate student in Berkeley, Dr. Greg Croft, a highly cited paper on this subject. I have also commented multiple times in this blog on the different aspects of the Hubbert curve analysis, its limitations, and predictive power.
Since I cannot out-talk or out-convince the numerous critics of this type of analysis, let me give you a simple example of its robustness. This particular story is as follows. At the end of the year 2010, Greg Fenves, at that time Dean of UT’s Cockrell School of Engineering in Austin, asked me to make a presentation to the School’s Engineering Advisory Board (EAB). Using the results of our recent paper with Greg Croft, I chose to speak about my new work on unconventional resources in the U.S. On April 09, 2011, I made the presentation, which was then internally published by the Cockrell School.
The first two Barnett shale plots shown below were based on the Texas Railroad Commission data through October 2010. In the presentation, I called these plots the “high production scenario.” The Hubbert curve with which I matched the production data ending in October 2010, went right between the two local peaks of the data. Of course there was an element of luck, helped by two decades of my experience as a reservoir engineer. Such experience or – for that matter – any other knowledge of reservoir engineering is absent among the economists, political scientists and journalists, who are paid to criticize this type of work.
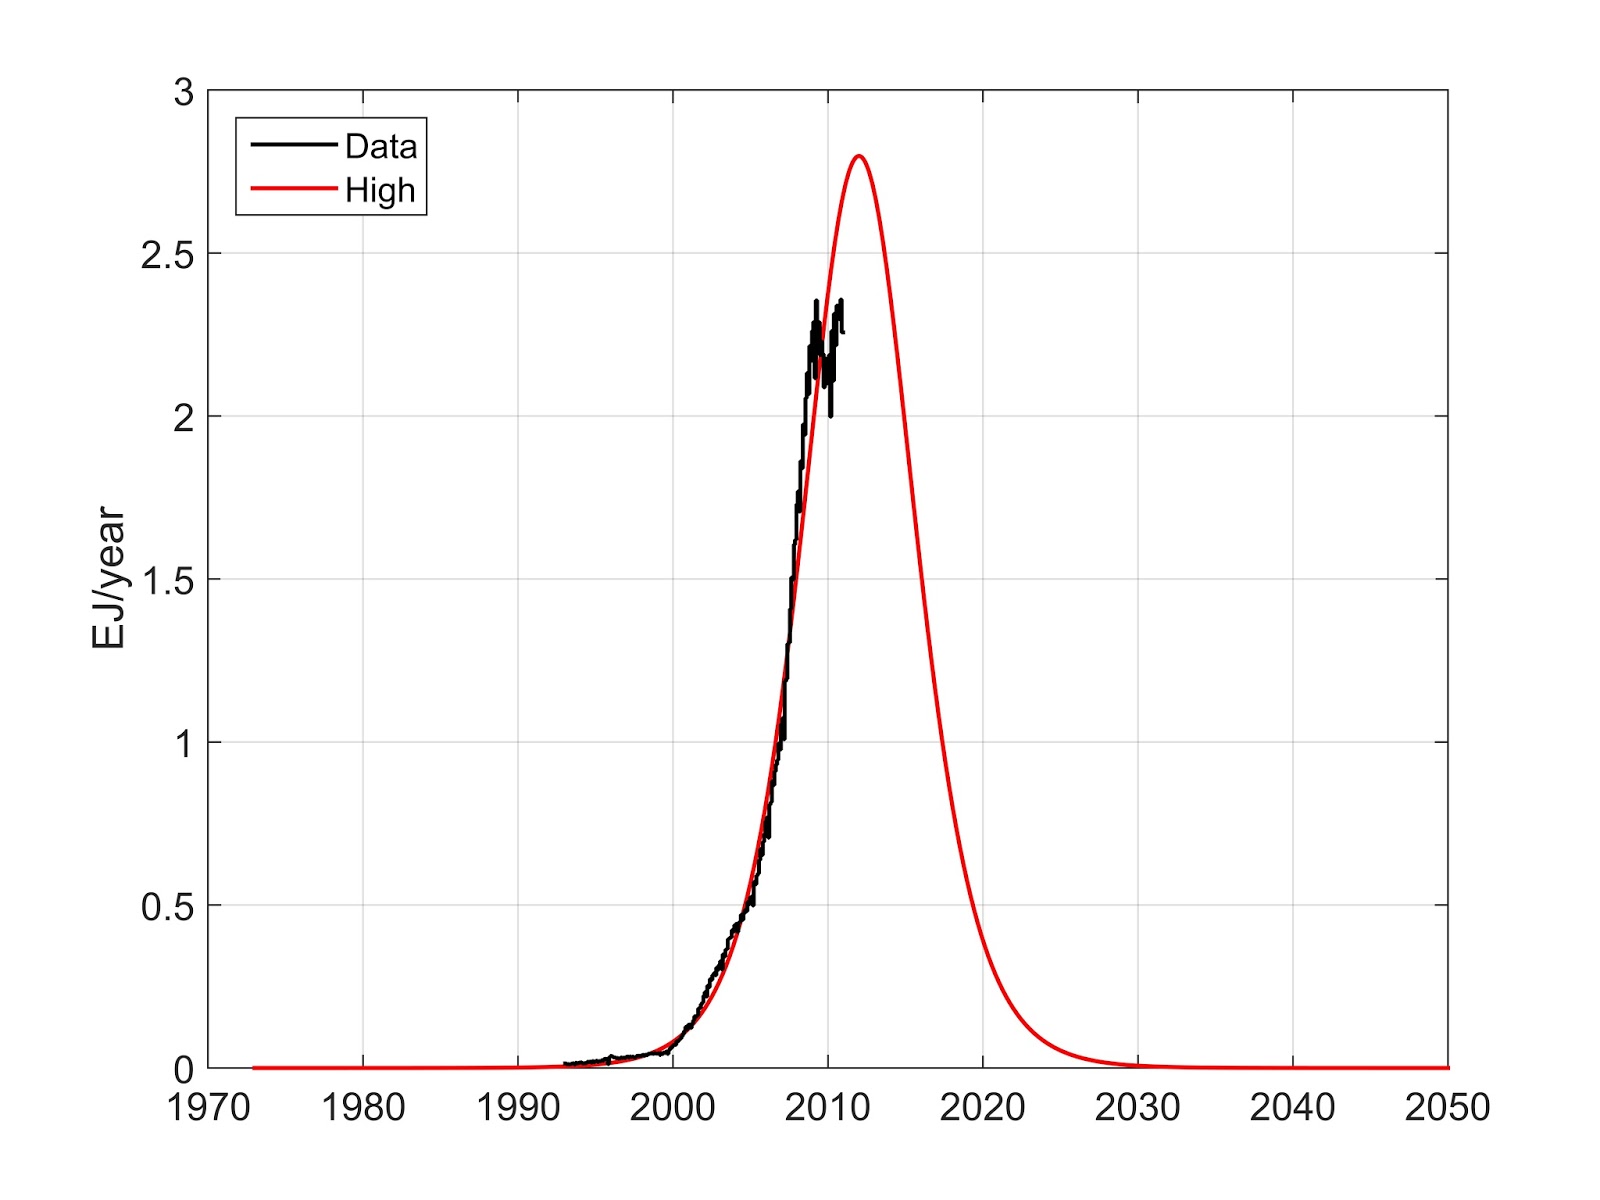 |
| To see this image in full resolution, please click on it. The total rate of gas production in the Barnett shale through October 2010, was matched with a single Hubbert curve. 1 EJ/year ~ 1 trillion standard cubic feet (TCF)/year. This “high production case” was presented in April 2011, at the Spring meeting of the Cockrell School Engineering Advisory Board (EAB) at the University of Texas in Austin. It was also made available electronically to the EAB members. |
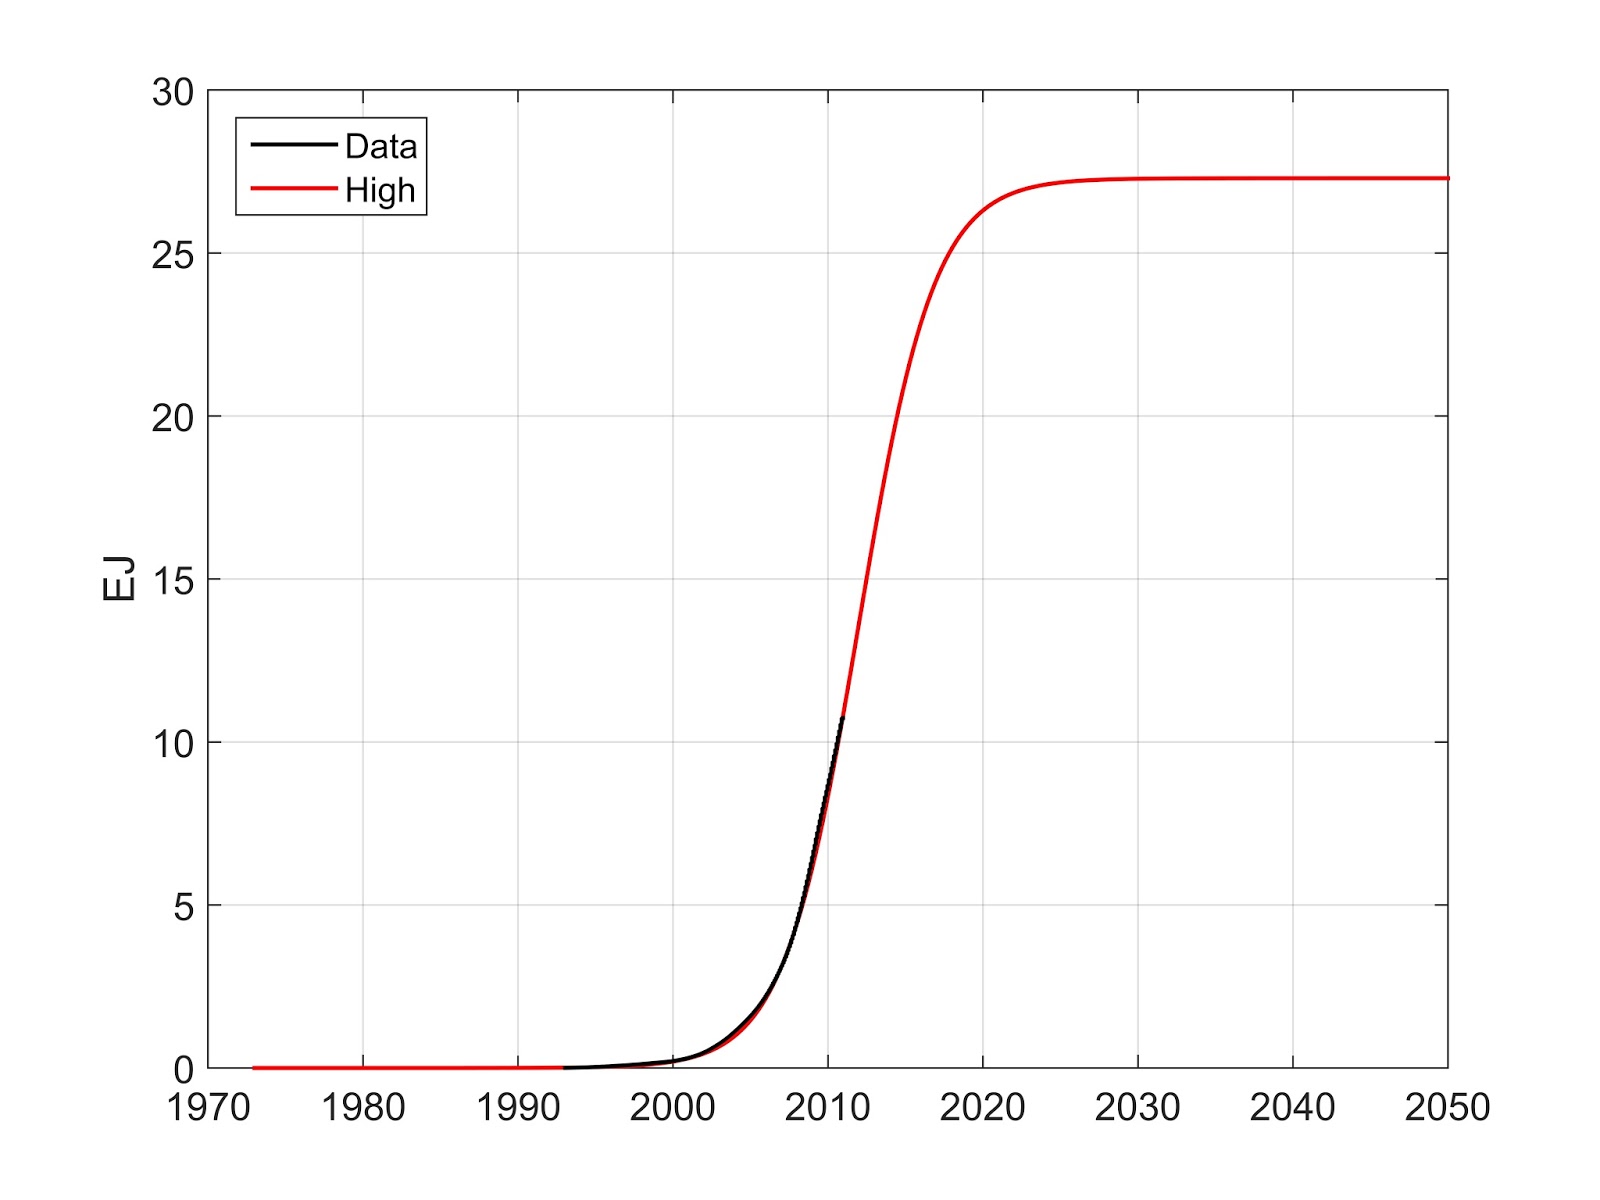 |
| To see this image in full resolution, please click on it. Cumulative gas production in the Barnett shale through October 2010, was matched with a single Hubbert curve (an integral of the bell curve shown above). The projected ultimate production was at least 27 TCF. 1 EJ/year ~ 1 TCF/year. |
In fairness to lay people, the respected reservoir engineers who saw these curves in 2011, smiled at my naïveté and predicted 60, 100 plus, or more TCF of gas production from the Barnett. In short, most experts were also amused.
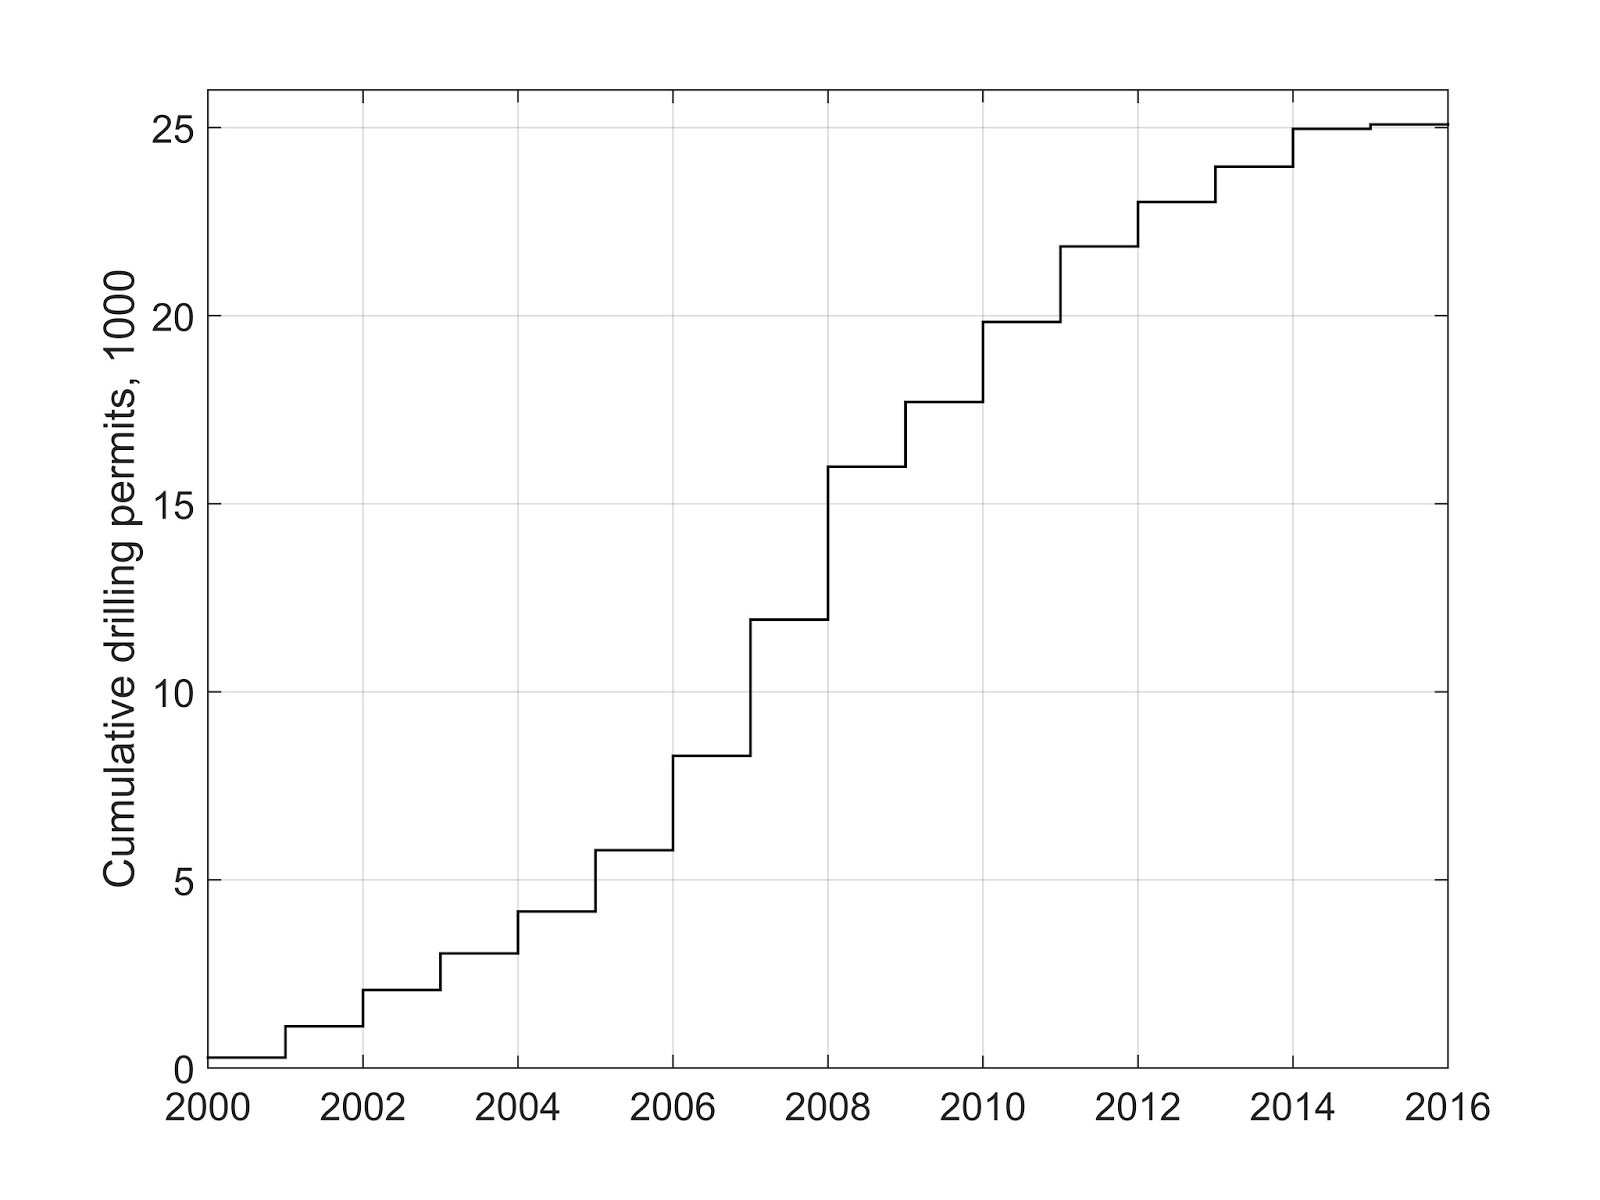 |
| Cumulative drilling permits issued by the Texas Railroad Commission for (the mostly horizontal) wells in the Barnett shale. Note that the cumulative permit curve follows a logistic S-curve similar to the cumulative gas production above, only shifted in time. Peak wells (4,065 at the inflection point in 2008) were drilled ahead of peak gas production in 2012. We are beginning to see the ultimate “carrying capacity” of past drilling in the Barnett. To change this S-curve, we need a brand new Hubbert cycle of drilling. |
What did I do? I used a two parameter curve (height and width) to describe and extrapolate production from close to 20,000 wells in the Barnett. I knew two things: (1) this production could be matched with one Hubbert curve or 2-3 of them, and (2) I had to go above current gas production (overshoot it) because this production had not already peaked. The first observation is based on the Central Limit Theorem explained in our paper, and the second one is an admission that more wells will be drilled and production will increase further, we just do not know by how much. Experience and intuition allow one to reasonably guess the size of this production increase. Guessing is an art and not all experts are artists.
 |
| To see this image in full resolution, please click on it. The total rate of gas production in the Barnett shale through March 2015, is matched with a single Hubbert curve. 1 EJ/year ~ 1 trillion standard cubic feet (TCF)/year. |
To see how good this December 2010 prediction was, fast forward five years. I should remind you that the Hubbert cycle predictions of future production of a very large number of wells and/or reservoirs are remarkably stable – the Central Limit Theorem makes sure of this, but I would not be happy if I predicted gas production in the Barnett shale with a 50% error. Luckily, as the plot above shows, I was right on the money, and no corrections were needed. Nevertheless, I could not resist tweaking the peak almost imperceptibly and increased the ultimate gas production from the Barnett by less than 1 TCF. Call it a reservoir engineer’s decease.
 |
| To see this image in full resolution, please click on it. Cumulative gas production in the Barnett shale through March 2015, is matched with a single Hubbert curve. The projected ultimate production is at least 28 TCF. 1 EJ/year ~ 1 TCF/year. |
In summary, given the current number of wells in the Barnett shale (over 25,000 drilling permits by now) and the already traversed peak of gas production, it is unlikely that I will have to adjust this prediction in the future, but let me play devil’s advocate.
The Barnett shale is most unusual in that it has two sets of fractures in the hydrofractured rock surrounding horizontal wells. One set is formed by the stress relief cracks from shear rock failure during hydrofracturing. Think of these cracks as being almost parallel to main hydrofractures and extending some distance away from both sides of these hydrofractures. But the Barnett shale is also likely to have another set of critically stressed (ready to pop), cemented natural fractures perpendicular to the hydrofracture planes. Together these two sets of fractures link during hydrofracturing and form large complex fracture systems that also communicate with the main hydrofractures. Thus, one could use this wonderful property of the Barnett mudrock, not replicated in other major shales, to create in the future many better and cheaper wells in the Barnett. If this happens, I will add a new Hubbert curve to my Barnett shale production model to account for the new wells, and happily report a significant increase (but not by 50%) of gas production there.
13 Comments on "Peak of Gas Production in the Barnett Shale"
Nony on Tue, 18th Aug 2015 7:32 am
Looks like a decent prediction. One question I have is what was the price assumption?
rockman on Tue, 18th Aug 2015 7:50 am
“One question I have is what was the price assumption?” Obviously a very valid point. Consider what the curve for the EFS would look like had oil prices stayed around $40/bbl since 2008. Conversely what would the Barnett curve look like had NG prices stayed above $10/mcf since 2008? The inherent problem with all production predictions: if you can’t accurately predict those prices 10+ years out how can one accurately predict future drilling activity and production?
Nony on Tue, 18th Aug 2015 9:40 am
Look at the Bakken in 2008/9/10. On/off/on.
Or even now, Utica and Marcellus. That is not a peaked field in terms of some normal development exhausting the resource. There’s just no more takeaway and consumption in area is limited. So there’s really only so much gas that can go to market. Any excess is essentially stranded. So it’s gas on gas competition. And price is in the ones. Even sometimes below one. Run a pipe to Louisiana and they will start producing like crazy.
rockman on Tue, 18th Aug 2015 10:35 am
Nony – Did you catch the note the other day about how little Chesapeake was getting for its Utica NG? I had not realized how small local demand was and how little transport out of the area there was. But makes sense given that Ohio has been an importer for the last few decades.
Nony on Tue, 18th Aug 2015 10:45 am
Have been seeing notes about Eastern Ohio being really bad for about a year. PA not much better but have heard OH worst.
apneaman on Tue, 18th Aug 2015 2:15 pm
Probably doesn’t matter since we have all but locked in the destruction of the systems that support us with AGW, ocean acidification and the 6th mass extinction. Glad I did not have any kids, especially girls. Good luck protecting them when the chaos ensues.
Methane Leaks in Natural-Gas Supply Chain Far Exceed Estimates, Study Says
http://www.nytimes.com/2015/08/19/science/methane-leaks-in-natural-gas-supply-chain-far-exceed-estimates-study-says.html?_r=0
Apneaman on Wed, 19th Aug 2015 1:01 am
Tads video from a few years ago – before it really cranked up. I do not know of anyone, scientist or layman, who predicted things would be this bad this soon even just five years ago. The speed of all the plant and animal die offs have really blown my mind.
https://www.youtube.com/watch?v=PXsvsksHi5g
Makati1 on Wed, 19th Aug 2015 2:18 am
Apneaman, I did have kids in the 70s. Two daughters and now six grand kids between them. I worry about their future and help them prepare as much as I can, but I do not see my kids or grand kids making it to 70 like I have. And maybe the grand kids, not even to their 30s. I hope that I am wrong, but I see no other possibilities as I do not believe in miracles.
Apneaman on Wed, 19th Aug 2015 2:30 am
Mak, I have twin nieces – 8 years old – adorable. Makes me sick to my stomach thinking about their future and knowing there is nothing I can do.
BC on Wed, 19th Aug 2015 2:45 pm
http://newnormaleconomics.com/2015/08/19/natural-gas/
Boat on Wed, 19th Aug 2015 2:56 pm
rock, nony
the other thing about price is demand. Even when the price is at it’s lows many humans can’t afford it. On the other hand no matter how high the price of oil there will always be people that can afford it. Humans have never been to good at predicting either the price of oil and price or demand destruction.
GregT on Wed, 19th Aug 2015 3:11 pm
“On the other hand no matter how high the price of oil there will always be people that can afford it.”
I suppose that those that can afford oil at any price, can always start up their own oil companies, refineries, and distribution networks.
GregT on Wed, 19th Aug 2015 3:58 pm
Once more energy is required to extract the oil, than the amount of energy provided by that oil, it is no longer a matter of affordability. It is a matter of common sense.
Which there appears to be a serious lack of these days.