Peak Oil is You

Donate Bitcoins ;-) or Paypal :-)
Page added on August 17, 2015
The Divergence Of Rig Count, Oil Price And Production Explained

Summary
- Since June, oil prices have plummeted 30% on concerns of a worldwide supply glut. Paradoxically, during this same period, the oil rig count has climbed by 74 rigs or 7%.
- This article analyzes this relationship between rig count and oil price to predict in which direction the rig count will move next.
- It also analyzes the relationship between oil production and rig count to complete the circuit and determine the evolution of oil supply in response to a change in oil price.
- Finally, I use this data to pinpoint a 3-month period during which I expect both domestic oil production and rig count to fall which will maximize bullish prospects for oil.
- My trading strategy based on this analysis is discussed in detail.
Since June 24th, crude oil prices have plummeted 31%, as fears of a global storage surplus, weakening Chinese demand, and a strong U.S. dollar have plagued the commodity and erased the late spring/early summer rally. Oil settled Friday just off a 6-year low at $42.50/barrel. However, even as the bottom was falling out of the oil sector, the oil rig count, as reported by Baker Hughes (NYSE:BHI), has surprisingly rallied by 74 rigs, or 7%, from a 5-year low of 628 during the final week of June to last Friday’s 672 active rigs. This contrasts sharply with the initial phase of the now 1-year oil downturn when both rig count and crude oil were falling in-step on a weekly basis from November through March, with each ultimately shedding over 50%. On the surface, this recent trend appears counterintuitive: Why would producers spend money to drill for oil that is progressively worth less and less? The divergence appears to be frightening many investors away. Over the last six Fridays on which Bakers Hughes reported that the rig count had risen, oil declined on five of those occasions, the only exception being this past Friday when the rig count climbed by just 2 rigs, the smallest weekly gain since mid-July. This article addresses this divergence in oil price and rig count, and discusses where both will track in coming months.
Figure 1 below illustrates the apparent divergence in rig count and oil price. During the March-June 30% rally in oil, the rig count fell from around 850 active rigs to around 630. Just as oil was peaking around $60/barrel, the rig count bottomed and, as oil has dropped back to new lows of $42/barrel, the rig count has bounced.
(click to enlarge)
Figure 1: 5-month comparison between rig count and oil price showing a deceptive inverse relationship between the two [Source: Chart is my own, data from Baker Hughes]
In reality, however, this is a case of data misrepresentation and not seeing the forest in spite of the trees. Figure 2 shows the same comparison of rig count and price over the past year instead of just two months, starting at the peak of oil near $110/barrel last summer through the initial crash, relief rally, and secondary correction.
(click to enlarge)
Figure 2: 15-month comparison between rig count and oil price showing a delayed response between oil price drop and rig count reversal, not the inverse relationship shown in Figure 1. [Source: Chart is my own, data from Baker Hughes]
Rather than the inverse relationship depicted in Figure 1, this data set suggests that there is a delay between the time that the price of oil experiences a reversal and when the rig count responds. The price of oil peaked during the summer of 2014 during the week ending June 20 while the rig count peaked 112 days or about four months later during the week of October 10. Likewise, the price of oil bottomed during the week ending March 13, 2015, while the rig count bottomed the week ending June 26, 2015, 105 days later.
This is further supported by looking back at the last great oil crash of 2008-2009. During that time, oil peaked at $146/barrel during the week ending July 11, 2008, while the rig count kept climbing until the week ending November 7, 2008, 119 days later, despite the fact that oil had dropped 50% from its highs by then. And once the price of oil bottomed out at $34/barrel in December of 2008, the oil rig count would continue falling until the week ending May 22, 2009, 154 days.
Thus, the apparent relationship shown in Figure 1 is an artifact of the time scale used and not truly indicative of the relationship between the rig count and oil price. When oil climbed north of $60/barrel in early May, many producers could earn a profit or, at least, minimize losses sufficiently to justify increased drilling activity to maintain market share. However, there is a substantial delay between the time that drilling becomes financially tenable and the time that a drill becomes active. This includes the time that it takes to move the rig to its new drilling location, if necessary, and to transport manpower and equipment to the drilling site. The same holds true once the price of oil drops below the point that drilling no longer makes financial sense. Rigs in progress continue to be drilled. If contracts for multiple wells or drilling contractors are in place, these wells will also be completed. It is expensive to shut down a rig so sometimes operators will continue drilling to see if a price drop is transient and followed quickly by a rebound. All of this leads to a delay between price inflection and oil response.
What does this mean for oil traders? Figure 3 below shows the times between oil price reversal and rig count response for the four major inflection points in the sector over the last six years.
(click to enlarge)
Figure 3: Average time period between oil inflection and rig count response during the 4 most recent oil crash and recovery events. [Source: Chart is my own, data from Baker Hughes]
The average response time is 122 days, or almost exactly four months. Note that the response time in 2014-2015 has been shorter compared 2008-2009. Figure 4 below uses this 122-day response time to plot rig count against the price from 122 days previously i.e. the price that the rig count is currently “seeing.”
(click to enlarge)
Figure 4: Adjusted Rig Count/Oil Price relationship showing the oil price that the rig count is currently “seeing.” [Source: Chart is my own, data from Baker Hughes]
This chart better depicts the relationship between rig count and oil price. Based on this data, the rig count is currently “seeing” oil prices of around $55/barrel and climbing from mid-April during the heart of the rally off the March bottom. Over the following six weeks, oil would continue to climb, reaching $60/barrel by mid-June. The current oil rig count will “see” this peak by the fourth week of September, after which time oil prices will “appear” to stabilize for another few weeks before beginning the sharp decline that we currently find ourselves in. This data therefore suggests that the rig count will see some continued upward pressure for the next two months or so before it begins to be influenced by the recent decline in oil price and resumes its decline.
As an addendum to this thesis, Figure 5 below shows the weekly change in rig count since the beginning of 2015.
(click to enlarge)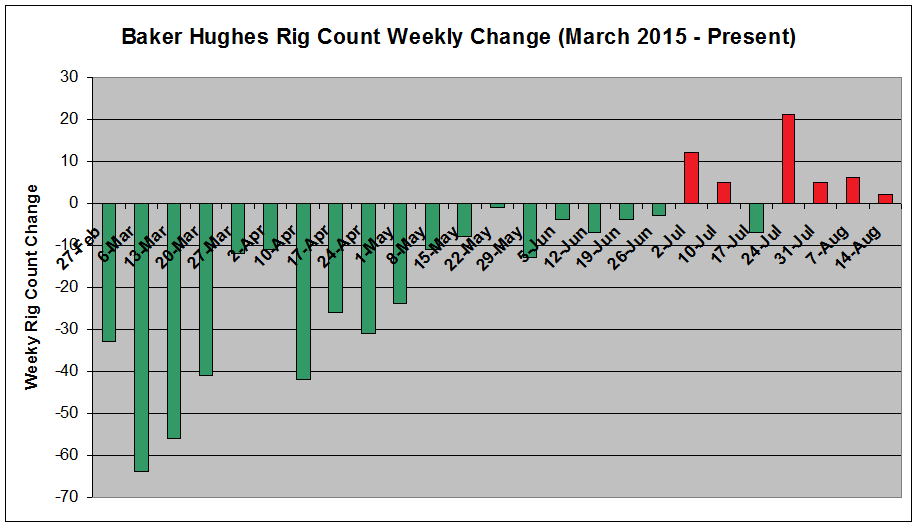
Figure 5: Weekly Rig Count change since March showing rig count declines leading to builds, but at a decreasing rate over the past month. [Source: Chart is my own, data from Baker Hughes]
After peaking at a 21-rig weekly gain for the week ending July 31, the rate of rig increase has declined to just +5, +6 and +2 rigs over the past three weeks. Given rapid drop in oil price to fresh 6-year lows and declining weekly increase in rig count, I would not be surprised if the rig count resumes its decline prior to late September.
Now let’s turn to the third component of the oil price-to-supply relationship: domestic production. Figure 6 below shows crude oil production over the past year.
(click to enlarge)
Figure 6: Crude oil production over the past year showing a peak in production in early June with a small decline since then. [Source: Chart is my own, data from EIA]
Production peaked at 9.610 million barrels per day for the week ending June 5 and has since declined 6 out of the last 9 weeks. At 9.395 million barrels per day for the week ending August 7, crude oil production is the lowest since the week ending May 22. It should be noted that production numbers, as reported by the EIA, are estimates of production and use both observed and modeled data. Therefore, final numbers may very well change in coming months.
In the same way that the response of the rig count to the oil price was analyzed above, we can do the same thing for the response of crude oil production to the rig count. Figure 7 below shows the unadjusted relationship of crude oil production and rig count.
(click to enlarge)
Figure 7: The relationship between crude oil production and rig count showing a large delay between a decline in rig count and a peak and decline in production [Source: Chart is my own, data from EIA]
As discussed above, the crude oil rig count peaked on the week ending October 10, 2014. It would be a whopping 238 days until oil production finally peaked the week ending June 5. Looking back at the oil crash and recovery of 2008-2009, it took crude oil production 148 days to begin declining after the rig count peaked and just 111 days to begin recovering after the rig bottomed.
Unfortunately, while the rig count/price relationship had relatively tightly clustered data points, the production/rig count relationship is all over the place. Due to the shallow recovery of rig count this year compared to 2009, I expect any recovery in oil production to follow closer to the 238-day period. However, for consistency’s sake, let’s average the 3 data points to reach a mean response time of 165 days.
Figure 8 below uses this 165-day response time to plot crude oil production against the rig count from 165 days previously i.e. the number of rigs that oil production is actually “seeing” right now.
(click to enlarge)
Figure 8: The relationship between production and rig count adjusted by 165 days that allows a comparison between production and the rig count that the production is currently “seeing.” This comparison shows that the current decline in production only takes into account about half of the declining rig count. [Source: Chart is my own, data from EIA]
As this chart shows, crude oil production is currently “seeing” a rig count of 986 – corresponding to the rig count from February 27. This represents 63% of the way through the net decline in rig count, but only 46% of the way through the period of decline. Based on this data, crude oil production may be expected to continue declining through the week ending December 4th before production may stabilize or climb slightly as it begins to “see” the recent upswing in rig count. If we assume that the current drop in production does represent 63% of the net decline in production, then weekly production will bottom out at around 9.27 million barrels per day – down 130,000 barrels per day from current levels and 342,000 below peak – before production stabilizes. Of course, as discussed above, I expect the rig count to resume its downward trend some time over the next 8-12 weeks, and therefore expect oil production to have a second dip, one that may ultimately take daily numbers south of 9 million barrels per day.
Figure 9 below summarizes the trends analyzed by two data sets discussed above – the rig count response to oil price and oil production response to rig count.
(click to enlarge)
Figure 9: Summary of rig count and oil production projections made based on the data in Figures 1-8. Should these projections verify, there will be a period between late September and the end of November when both rig count and oil production are simultaneously in decline. [Source: Chart is my own, data from EIA]
As this chart shows, I expect that there will be a “sweet spot” between late September and early December when the rig count resumes its decline due to the recent abrupt drop in oil price, and domestic crude oil production continues its decline due to the drop in rig count associated with the initial drop in oil price from late 2014 and the first quarter of 2015. It is during this period that I expect oil to have its greatest bullish momentum.
As I discussed in my article entitled, “This Oil Bear Is Now A Bull – The Case For Higher Crude Prices“, from two weeks ago, one of my main tenants was a tightening domestic oil market thanks to declining production and strong demand due to cheap oil. My only concern was increasing imports due to a significant oversupply on the worldwide market. Indeed, I expect the driving story for oil over the next few months will be a tightening U.S. supply/demand picture versus an excess of international oil, which is ironic given that it was fears of Middle Eastern conflict that drove oil prices above $100/barrel, and the emergence of the Fracking Era and a domestic supply glut that sent them crashing back down last fall.
In that article, I discussed my plan to enter oil long positions in the non-leveraged United States Oil ETF (NYSEARCA:USO), as oil declined to the March lows, and then begin shorting the leveraged oil ETFs, the 2x ProShares UltraShort Bloomberg ETF (NYSEARCA:SCO) and the VelocityShares 3x Long Crude Oil ETF (NYSEARCA:DWTI), to gain long exposure that would also benefit from leverage-induced decay to help offset contango-induced losses.
Since then, I have backed off this aggressive stance somewhat given in part the data discussed in this article. Unfortunately, the market has largely ignored weekly declines in the storage surplus and production, and continues to focus on the international supply glut – which is not unreasonable. Outside of an oversold bounce, I fear that there are not enough drivers in place right now to sustain a prolonged crude oil rally. However, should production and the rig count – which has been followed closer than ever during this oil crash – begin declining in-step as I expect them to during the September-December time period, I expect bulls will return en masse. Therefore, my holdings currently consist only of a USO position worth about 6% of my portfolio after a small addition last Friday. As the calendar rounds to September, I plan to add to this position to raise it to about 8-10% of my portfolio and begin slowly adding SCO and DWTI shorts should crude oil drop below $40/barrel.
In conclusion, there is a delay of 3-4 months between when oil experiences an inflection point and when the rig count responds. It is this delay that is presently giving the false sense that the oil rig count is moving inversely to price. Likewise, there is a further 4-6 month delay in the time that the rig count drops and when production begins to slow. The combination of multiple large drops in crude oil price and the relationship between oil price, rig count and production lead to a complex supply/demand picture going forward. This article analyzes these relationships and tries to predict how and when the rig count and production will respond to the recent drop in price. Admittedly, my analysis makes multiple assumptions and perhaps oversimplifies several components of the relationship. However, it provides, at the very least, a framework for the evolution of the oil rig count and oil for the next 6 months. Based on this analysis, I am projecting a 3-month period during late September through November when the rig count and production will both be declining. It is during this period that I want to most aggressively be long oil.
29 Comments on "The Divergence Of Rig Count, Oil Price And Production Explained"
Nony on Mon, 17th Aug 2015 7:26 pm
Good article for explaining lag in US production.
Only thing missing perhaps is some discussion of level needed for maintenance. IOW, if rigs go from 620 to 670, that is a jump but if we need say 800 rigs to keep production flat, than you still decline, just slightly slower.
coffeeguyzz on Mon, 17th Aug 2015 8:36 pm
Nony
There is actually a far more micro, much more compressed time frame involved in ramping up output vis a vis pricing … and this was clearly displayed by Rune Likvern’s chart on Oasis’ production posted the other day on Mr. Patterson’s blog.
Rune had vintage (2010/’11/’12 etc) production color coded. The chart not only showed a very sharp drop late 2014/early 2015, there was an across the board INCREASE in the spring months as prices temporarily rose.
The only way wells can uniformly increase production (simultaneously, no less) is if they were being choked back in the first place.
Thus, in addition to the DUC wells, which have a few month lagtime from being production ready, there are numerous wells whose output can be measurably increased almost immediately as pricing dictates.
coffeeguyzz on Mon, 17th Aug 2015 8:55 pm
Correction:
Likvern’s chart showing quick drop/increase was for Slawson, not Oasis.
Boat on Mon, 17th Aug 2015 9:19 pm
One thing to remember, While rig counts are down 600 in the US they are down 1,000 around the rest of the world over the last year. Question is, how many more rigs need to shut down to eat up that 2.5 mbpd glut. How much more lag time is needed. Are we already in overshoot?
Makati1 on Mon, 17th Aug 2015 10:17 pm
Who cares about someone’s take on the situation? Most are just articles to justify a paycheck and are only variations on all of the other articles.
Not one of them can tell me with 100% certainty, what the situation will be tomorrow, and certainly not next year.
It’s like when I took my blood pressure at different times of the day. It was always different and the variables that control it are too many to make a perfect prediction, so I stopped taking it. I can judge by how I feel whether it is high or low or ‘normal’.
Ditto for oil. I look at the price of things I buy. The number of stores closing. The cost of a taxi ride. All of the things I actually need. Not the latest guess at the price of petroleum next month or next year. Who cares, besides the ‘investors’? Not one of us can do anything about it, so why be concerned. Just prepare for the future and let it happen. It will anyway.
Nony on Tue, 18th Aug 2015 12:30 am
yeah there has been choking as well. in nd, the flaring restrictions can affect that as well as oil price
GregT on Tue, 18th Aug 2015 1:33 am
There’s going to be a lot of “choking” in the near future Nony. You’ve had plenty of opportunity to wake up, but you haven’t. After all is said and done guy, you deserve what is coming to you.
rockman on Tue, 18th Aug 2015 6:50 am
Too bad during last January no one pointed out the lag time between rig count and first production (which has been documented for decades) to offset the crowing by the cornies over increased production during 1Q 2014. Better late than never, eh? LOL.
Of course there’s another relationship between rig count and production: if a company doesn’t have the capex they aren’t going to drill sh*t regardless of the price of oil. The good news: lower drilling activity reduces completion and thus brings the cost per foot down. Likewise the weaker prospects don’t get drilled so that also gives an impression of greater efficiency. But the capex for almost all companies has two sources: cash flow and debt. Obviously cash flow as a result of lower prices is down. But drilling fewer wells (even if the average initial rates increase) delivers less cash flow also.
But the greater hindrance is the loss of credit lines. As soon as oil prices began to slide the value of existing reserves was reduced. And since credit lines are typically based upon the VALUE of the reserves and not the VOLUME $billions in credit lines disappeared as prices fell. Of course at the same time the debt repayment schedules didn’t change. At least until now. We’re beginning to see the equity for debt swaps picking up steam. Essentially Company A owes twice as much debt as their asset value…or even more. But the creditors are trapped: if Company A is liquidated it won’t cover the debt given it has become a very strong buyers’ market. So while it might seem counterintuitive some lenders are providing more capex to their debtors on the hopes it will allow them to stay solvent until better times arrive. Old saying in the oil patch: owe the bank $100,000 and they own your ass…owe the bank $100 million and you own their ass. LOL.
But the price is steep. One offshore drilling contractor just got a $300 million capex infusion. And the cost (beyond the interest): they’ve given 98% of the company to the creditors. Thus if the company doesn’t survive the creditors get virtually 100% of the liquidated value. But if the company recovers the lender not only gets the loans repaid but also all the profits. And that could be huge if the market value of the stock increases multiple times.
But in the end it isn’t a reprieve but a delaying action. If activity/oil prices stay low most of these companies will still disappear.
Nony on Tue, 18th Aug 2015 7:13 am
I did.
Nony on Tue, 18th Aug 2015 7:14 am
So did EIA. (And got a lot of grief from peakers thinking they were too optimistic.)
Nony on Tue, 18th Aug 2015 7:16 am
Rock,
At the end of the day, prospects are going to get drilled if it makes sense. If the current owner lacks capital, they will get funding (debt, equity, PE, etc.). If they can’t get funding, then the assets will trade hands.
The slowdown in drilling is NOT from lack of capital. A lot of these companies have undrawn revolver loans. Drilling has slowed down because, at this price, a lot less wells make money.
Davy on Tue, 18th Aug 2015 8:01 am
A lot of these companies have undrawn revolver loans being drawn back by the banks is more like it NOo.
rockman on Tue, 18th Aug 2015 8:17 am
I reviewed no less than 10 EFS prospects that would make sense to drill today thanks to lower costs (we do have $250 million CASH available from our owner). And not one of those companies has access to funds to drill and are thus looking to farmout acreage to my company at very generous terms. Of course we won’t drill any of them because fracture production doesn’t fit our business plan. But my owner wanted to see which companies might be cheap bankruptcy targets.
Tomorrow I’ll be attending the NAPE (North American Prospect Expo) event in Houston. I expect to see a great many trades offering shale projects at very good terms. Companies will either get someone to drill their acreage or the leases will expire and they’ll get nothing out of those investments. Hundreds of $millions in leases will expire for lack of drilling. And some of those leases would be drilled by the owners if they had the capex to do so.
Again a reminder to folks about credit lines for pubcos: they are based upon th4 booked value of their production. Which is directly proportional to the price of oil. As oil prices fell $billions in credit lines were cancelled.
Yeah…lots of capex available out there. Obviously a publication titled “Oil and Gas Investor” wouldn’t understand that. LOL. From O&GI last month:
“Once again, a slide in oil prices is bringing pain to the junk-bond market. In just two weeks, speculative-grade energy securities have tumbled more than 3 percent, dragging down the entire U.S. market, according to Bank of America Merrill Lynch index data. Yields on the debt have climbed to an average 9.34 percent, the highest since February and approaching levels that indicate investors view the typical security at high risk of default, Bloomberg said July 7. Demand for the debt is evaporating as the latest slump in oil revives concern that high-yield energy companies will struggle to service the record $120 billion they borrowed in the past three years to finance production during the shale boom. Swift Energy Co., an oil and gas explorer, is struggling to find buyers for a $640 million loan, while investors who lapped up second-lien energy bonds earlier this year are now racing to dump them. “The energy sector of the high-yield market continues to be a silo of misery,” Margie Patel, a money manager for Wells Capital Management in Boston, which manages $351 billion, said in a telephone interview. “If we stay near these levels, marginal high-cost producers won’t be able to survive.”
shortonoil on Tue, 18th Aug 2015 8:28 am
The author is suggesting that there is a correlation between rig count, and price with a time lag (122 days). That may be, then again, maybe it’s not. The apparent correlation could be just coincidence, and may not hold up into the future. His third graph, “Adjusted Crude Oil Rig Count vs Price” demonstrated that past 08/21/15 he is guessing at either rig count, or price. His projected price by 08/21/15 is about $57, and his projected price by 09/11/15 date is $60. WTI opened at $41.37 this morning.
His claim that rig count sees a price is probably not as important as rig count sees the financing to continue operations. Reuters is of the opinion that there is big money with deep pockets coming into shale:
http://mobile.reuters.com/article/idUSKCN0QJ0BH20150814
and that they are basing their decisions on the belief that prices are going to increase long term. We don’t believe that can happen, and ever increasing world inventories supports that conclusion:
http://www.thehillsgroup.org/depletion2_022.htm
The author’s projections do not contradict our Model, but they don’t support it either.
But basically, a one year plot of rig count vs price does not a model make.
paulo1 on Tue, 18th Aug 2015 8:37 am
re: “My only concern was increasing imports due to a significant oversupply on the worldwide market.”
Gee, yah think? I am reminded about the meme of the last election. Didn’t it go something like this, “it’s the economy, stupid”. Oil these days is a factor and reflection of our slowing economy, not the driver. Just my opinion these days, but I believe if the price was $20/bbl we would be even in more economic trouble. Do we need any more plastic crap from slave labour wage rate countries?
The big spike would come from conflict in the ME, like Saud falling prey to uprising, or Israel bombing Iran. And oil would go up in price, but the economy would even worsen.
Get used to less with less, folks.
Nony on Tue, 18th Aug 2015 9:54 am
Rock,
1. That is my point. If the prospect is desirable, it will get drilled even if it needs to change hands to do so.
2. I guess a BK would allow you to get some expertise. (Otherwise how would it make any difference to your business model concern.) Would mean conceding that your Austin Chalk work didn’t keep you current with modern shale work.
3. I heard a few weeks ago that prices had not really come down that much (for assets). Are they starting to come down more? Seems like more deals are getting done last few weeks.
shortonoil on Tue, 18th Aug 2015 9:57 am
“Oil these days is a factor and reflection of our slowing economy, not the driver.”
So what does drive the economy; Cheese Doodles? Is there a Doodle per mile graph? It takes energy to power the economy, and that is what you get from petroleum. Energy drives the economy, the economy does not drive energy. The economy is short a few Doodles to do that! When the energy is no longer flowing, everything else just stops, and the world economy from Beijing to Houston is stopping. Q.E.D.
paulo1 on Tue, 18th Aug 2015 10:07 am
Debt, Short. Debt and propaganda.
Yes, I know about the role of energy. I have been following this stuff for at least 15 years, now. I am just saying we are at limits for growth. No growth requires less energy. No growth means lower prices for energy until even that declines.
We aren’t going to burn 100$ oil making your snidely referenced doodles. However, we may burn it on the wheat field.
It is not one driving the other. It is not photo-synthesis. It is a dynamic relationship and mutually reinforcing as you so often point out in your posts.
Most of the ‘stuff’ we think of as our economy isn’t really all that necessary for life or living quality, is it?
Davy on Tue, 18th Aug 2015 11:27 am
Short, you can’t claim one or the other (energy/economy) is dominant in their relationship. It is a complex systematic relationship and ever more so with hyper globalization. One is a resource and the other a system. We don’t eat oil we eat it after the system has eaten it.
GregT on Tue, 18th Aug 2015 12:01 pm
The Future History of Political Economy
“It’s odd, then, that alone among disciplines with any pretense to analytic rigor, economics has steadfastly resisted the thermodynamic revolution that swept physical and life sciences in the nineteenth and early twentieth centuries. Physics, biology, chemistry, geology, even the study of history were transformed, but not economics.”
“I think we can blame this on bad timing, willful ignorance, and oil.”
“you might expect that a discipline with such a demonstrably deficient view of its subject matter would fail of its object—would fail to offer wise counsel about the collective project of augmenting the stock of wealth that humans can enjoy.”
“When your economy operates on an energy source that cranks out wealth-making value in a ratio of 100 to 1 or better—the estimated Energy Return on Energy Invested that petroleum offered us in the early 20th Century—you can believe any damn thing you want about how economies operate and your economy will still generate a great deal of wealth.”
“In effect the discipline of economics has a free rider problem—it’s been given a free pass by the enormous power of oil to misunderstand itself and its subject matter. ”
http://www.resilience.org/stories/2015-06-05/the-future-history-of-political-economy-part-1
http://www.resilience.org/stories/2015-06-15/the-future-history-of-political-economy-part-2
shortonoil on Tue, 18th Aug 2015 1:31 pm
“Short, you can’t claim one or the other (energy/economy) is dominant in their relationship. “
All motion that requires a change in velocity requires energy to occur. That is as basic physics as it gets. All economic activity requires motion that changes in speed and, or direction (velocity). No energy, no motion, no economy; period. The world’s supply of usable energy is declining; the world’s economy is declining. How any complex system responses to that depends on the system, but when the energy supplied to any system declines by one half the system’s activity will decline by at least one half. It is not system dependent!
If it was system dependent we could build perpetual motion machines. Last that I heard, we can’t!
BC on Tue, 18th Aug 2015 2:26 pm
George Mobus: Exergy:
http://questioneverything.typepad.com/question_everything/2010/10/work-exergy-the-economy-money-and-wealth.html
https://gcep.stanford.edu/research/exergy/resourcechart.html
https://gcep.stanford.edu/pdfs/DyUMPHW1jsSmjoZfm2XEqg/1.3-Hermann.pdf
The bottom 90-99% of the US population can no longer sustain the net energy requirements per capita/household of the top 0.001-1% living primarily in metro areas/regions such as NYC, Boston, DC, Chicago, Dallas-Houston, Denver, SF Bay Area, LA, and Seattle/Vancouver.
Wall St., LA, Dallas-Houston, Chicago, SF Bay Area/Silly-Con and Social Mania Valley, and DC, for example, consume overwhelmingly disproportionate share of net energy per capita and receive a similar share of income at the expense of the rest of the country and the world.
BTW, if one adjusts US oil production per capita for the supply of debt-money created, a portion of which is used to produce, process, and consume oil, the US is producing no more oil per capita in debt-money terms than in the 1930s-50s; and we never will produce more, i.e., have a surplus that we can afford in order to grow future production or real GDP per capita.
Davy on Tue, 18th Aug 2015 2:32 pm
No economy leaves energy as potential energy is my point. You need a gun barrel to fire a bullet. You need an economy to facilitate the utilization of potential energy into utilized energy. I am not arguing the correctness of your above comment just pointing out modern energy sources are so tied into and dependent on a global economy.
Davy on Tue, 18th Aug 2015 2:42 pm
Default Wave Looms As Energy Sector Credit Risk Surges To Record High
http://www.zerohedge.com/news/2015-08-18/default-wave-looms-energy-sector-credit-risk-surges-record-high
shortonoil on Tue, 18th Aug 2015 6:37 pm
@BC
http://questioneverything.typepad.com/question_everything/2010/10/work-exergy-the-economy-money-and-wealth.html
Excellent article, and anyone having trouble with the Etp Model should read it. However, a few of the references he makes to “daunting tasks” we have solved by using an entropic analysis of petroleum production.
http://www.thehillsgroup.org/depletion2_022.htm
BC on Tue, 18th Aug 2015 8:58 pm
short, right on, brother.
http://newnormaleconomics.com/peak-oil/
Historically, US real GDP per capita does not grow with the constant US$ price of oil over $30-$40, and Wall St., the big integrated oil companies, Mossad, and the Pentagon war planners (and probably the Persians, Saudis, and Chinese PLA leaders) know this very well, and so much more.
BTW, George Mobus is a brilliant guy, and he has begun to envisage a model of human evolutionary “eusociality” as similar to ants, which by definition would also imply a possible model of that of bees. Note, however, that human apes’ population overshoot conditions, Peak Oil, and our increasing use of petrochemical fertilizers, herbicides, and pesticides are risking destroying the symbiotic pollinator insects upon which we rely for our food (and that of the animals we murder for their flesh).
Rather than self-aware, enlightened creatures, we are demonstrably and collectively UNCONSCIOUS, suicidal, ecocidal organisms benefiting an infinitesimally few at the expense of extinction of the rest of us.
http://www.imdb.com/title/tt0070531/
Therefore, my bet is on six-legged eusocial creatures over human apes, although I (and none of us) will likely be able to collect on the bet. 🙂
farmlad on Tue, 18th Aug 2015 9:27 pm
Short Thanks for the link, good read.
Nony on Wed, 19th Aug 2015 5:00 pm
Talked to a guy in a small PE-backed concern. They had discussions a while ago with a decent sized independent about buying some fringe shale acreage (some production). Initially it was 34-32 standoff and discussion broke down. Then called in recently and a standoff at 26-24. Finally closed at $9 MM. So asset value dropped to almost a quarter.
Mark67 on Wed, 7th Jun 2017 8:45 am
Hi, do you allow guest posting on peakoil.com ? 🙂 Let me know on my email