Peak Oil is You

Donate Bitcoins ;-) or Paypal :-)
Page added on February 6, 2015
Commodities explained: Oil and rig counts

The weekly US rig count data, published on Friday, have generated considerable excitement in the oil markets recently, with the numbers released by oil-services group Baker Hughes moving crude prices.
What’s going on?
The numbers identify the level of drilling activity and have traditionally been regarded as a gauge for the health of the US oil industry. They have come under the spotlight since the oil markets have tanked and traders and investors try to figure out what low prices mean for US shale production. The latest figures showed that oil rigs have fallen 24 per cent from the recent peak of 1,609 in October last year. Last Friday’s figures were particularly stark, with 7.1 per cent of all US rigs idled in one week.
OK, but what is a rig, exactly?
These are not the big oil platforms in the North Sea or the Gulf of Mexico. They are used to drill wells, from where the oil is extracted. After the drilling is completed, a rig will be moved off site and the wellhead topped. So rig count reflects exploration and development of oil and gas wells rather than actual production.
But is it still a leading indicator of what’s about to happen to the oil and gas sector?
The data are a good benchmark of the health of exploration and production companies, as well as the oil-services groups. And yes, they give you some direction of oil production.
But be warned, not all rigs are the same. Technological advances in drilling mean that all sorts of productivity increases have been made over the past few years and that you need to look below the headline numbers. For example, horizontal drilling, along with hydraulic fracturing, or “fracking”, has led to big output increases in shale oil and gas production. But rig count numbers show the number of horizontal rigs has not fallen as much as other conventional rigs.
What do you mean by horizontal drilling?
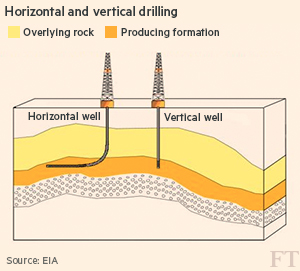
A rig drills down to the layer of oil or gas-producing rock formation. Compared with a vertical rig, whose access to the oil-producing rock is limited, with a horizontal rig the drill makes a turn into the layer. The technology has enabled more production and its evolution continues.
So far, the numbers of rigs that are vertical and directional (those dug at slight angles) have fallen faster than that of horizontal ones. Morgan Stanley says that since mid-October horizontal oil rigs have fallen only 16 per cent, compared with 41 per cent for vertical and directional. The bank also points out that most of the rig-count falls have been in regions that are less productive than others.
Then should we be looking at rig counts at all?

Yes, but do handle the data with care as the correlation between rig count and production has become increasingly less straightforward.
Some analysts point to the natural gas example, where US rig counts started to fall in 2009 but production failed to decline as much. With drilling technology continuing to advance leading to more production efficiency, output may not fall as much as the headline rig count suggests. In fact, Citigroup forecasts that without a “sizeable” cut in rig counts at the leading shale regions, Bakken, Eagle Ford and Permian, production could still continue to rise.
This article is part of an online series on commodities made easy
11 Comments on "Commodities explained: Oil and rig counts"
Plantagenet on Fri, 6th Feb 2015 4:06 pm
Its hard to believe that US oil production in shale regions could continue to rise at these low oil prices. If so, then oil prices will have to go even lower to reduce production and end the oil glut.
bobinget on Fri, 6th Feb 2015 4:46 pm
When four months ago I wrote low oil prices are
‘transitory’ HRH replied in the negative.
When I posted the real reason for low oil prices was more political then supply/demand driven, HRH
rubbished my remarks.
Today when liquid fuels shortages are practically guaranteed, Himself is amazed not everyone
believes low oil prices are here to stay.
Some of us are reactive, others proactive.
Plantagenet on Fri, 6th Feb 2015 5:24 pm
Hi bob
You are having a delusion.
I’ve never said tha today’s low oil prices are permanent. Of course they are transitory—they are the product of a transitory oil glut.
There is no way to say how long the oil glut and these low prices will last—-but if US production continues up in spite of the current low prices then the oil glut is going on a bit longer.
Get it now?
Cheers!
shortonoil on Fri, 6th Feb 2015 6:53 pm
A rather deceptive article, as there is a difference between wells drilled, and wells completed. As of January 1 there were about 750 wells in the Bakken alone that had been drilled, but had not yet been completed. Fracking crews have historically run several months behind drilling. Once that backlog of wells is brought online, production will begin to decline as there is now not enough new wells being drilled to compensate for the high decline rate of shale wells. That will probably not be until April or May, and the reports will not be available until June.
As prices will never recover to the $100/barrel level, shale production will be in steep decline by the end of this year, and obviously have collapsed by 2017. As half of the energy extracted from petroleum is now used to produce it, and it products demand will fall as production falls. This will keep a downward pressure on prices that will further reduce production. Petroleum is now in a downward spiral that can not be reserved.
http://www.thehillsgroup.org/
GregT on Fri, 6th Feb 2015 7:07 pm
I hate to say it short, but It certainly appears that you are correct.
Beery on Fri, 6th Feb 2015 8:41 pm
And so, we are at “peak all liquids”. We just don’t know it for sure yet – not until 2017 anyway.
Amvet on Sat, 7th Feb 2015 5:28 am
The EIA publishes a monthly drilling report on shale fields. On 9 Feb, the next report will be published. From the current report here is a list of what percentage of the new production is being negated by the production decline of old wells.
76.7% 84.2%, 100%, 75%, 82%, 62%, amd 66%.
For NG,
74%, 76%, 76%, 75%, 79%, 66% and 38%.
In view of this, long range predictions of production increases 5 to ten years from now seem unfounded.
shortonoil on Sat, 7th Feb 2015 7:20 am
76.7% 84.2%, 100%, 75%, 82%, 62%, amd 66%
The EIA appears to have arrived at these figures by extending the production curves to infinity. In fact, as the price declines these wells will be shut-in at an earlier and earlier date. For example, a five year old, 11,200 foot Mackenzie county well producing 46 b/d with a 90% water cut has energy lifting costs of a $27/barrel. When WTI was at $100, and well head price was better than $80 that was feasible. At today’s prices, the OP of a five year old well can’t even be covered. The production curves of these wells instead of drifting off into a long future are now being cut very short. Legacy production will be much less than the EIA is estimating.
http://www.thehillsgroup.org/
Danlxyz on Sat, 7th Feb 2015 8:46 am
Short, How do you come up with the $27/bbl lifting cost? Does it include all operating expenses?
rockman on Sat, 7th Feb 2015 10:50 am
Sorry shorty you lost me here: “At today’s prices, the OP of a five year old well can’t even be covered.” I’m drilling in a field with some 68 year old wells with each making 2 bbls of oil and 98 bbls of water a day and they still have positive cash flow. Not a lot but still positive and worth producing.
And that’s a case approaching a marginal limit. I have a 4 year old well in La that would still be commercial at $10/bbl. But there certainly are some wells that have slipped into negative cash flow…I have one on La right now. But it would still be losing money at $100/bbl. Which is why I’m struggling to make a commercial recompletion…which doesn’t look promising at the moment. And wouldn’t like a much better gamble if oil were $100/bbl. Probably time to set cement plugs and cut the bitch’s head off. LOL.
Yes: just like ships wells are of the female persuasion.
rockman on Sat, 7th Feb 2015 1:17 pm
Just a reminder about not getting carried away with predicting trends that haven’t fully developed. I think it was shorty that pointed out the lag time from between when a rig is stacked (stops drilling indefinitely) and when the wells it drilled are frac’d and start producing. And that’s just half of the lag time. Consider the Texas production I pull off of Drilling Info this week. Unless someone is going directly to the Texas Rail Road Commission to pull up data directly (a not very user friendly site) they are getting info from sites like DI. The most current production posted on DI is Nov 2014 from the TRRC. And that’s wells frac’d and put on production no more recently then Oct or Sept. Which are wells that were drilled during the summer of ’14.
IOW it will be early next summer before we see the full impact of fewer rigs drilling today in the production numbers.
Playing the guessing game today is just spinning one’s wheels in the mud. By next Aug making such projection will be much more obvious IMHO. Aside from the futures players the oil patch can’t be viewed properly in the 24-hour news cycle.