Peak Oil is You

Donate Bitcoins ;-) or Paypal :-)
Page added on January 1, 2015
Occam’s Oil

As my colleague Joe Calhoun continually reminds us, everything that happens has happened before. The ongoing “struggle” to define what is driving crude oil prices lower is perhaps another instance of a past “cycle” being reborn. With oil prices now heading much closer to the $40’s than the $60’s, consistent commentary is increasingly swept aside.
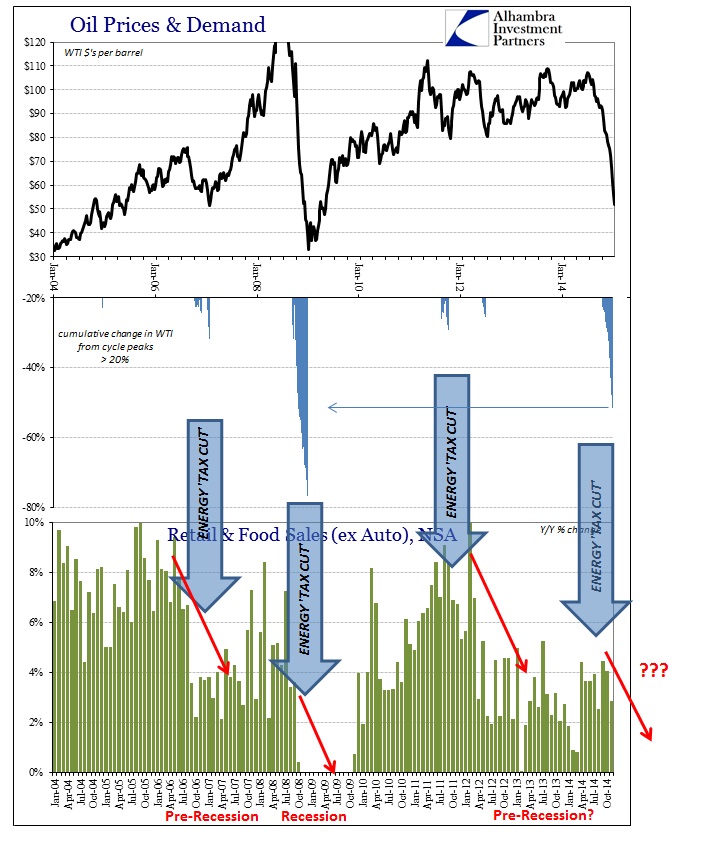
The move in crude these past six months is now nothing short of astounding. At about $52 current prices (which will probably move in either direction significantly by the time this is posted) the collapse from the recent peak now equals only past, significant global recessions under the oil regime that began in the mid-1980’s.
That comparison includes the 1997-98 Asian “flu” episode where the mainstream convention was also totally convinced of only massive oversupply defining price action. This was incorporated even into the International Energy Agency’s (IEA) estimates of oil inventories, as described shortly thereafter by certain incredulous oil observers:
Fourteen months have passed since the International Energy Agency’s oil analysts alerted the world to the mystery of the “missing barrels.” This new term referred to the discrepancy between the “well-documented” imbalance between supply and demand for oil and the lack of any stock build in the industrialized world’s petroleum supply. In April last year [1998], the IEA’s “missing supply” totaled only 170 million barrels. At the time, the IEA described this odd situation an “arithmetic mystery,” but assured us that these missing barrels would soon show up. As months passed by, stock revisions occasionally too place, but often in the wrong direction. Rather than shrink, the amount of “missing barrels” grew by epochal proportions.
By the publication date of the IEA’s April 1999 Oil Market Report, the unaccounted for crude needed to confirm the IEA’s extremely bearish views of massive oversupply of oil throughout 1997 and 1998 ballooned to an astonishing 647 million barrels of oil. Two months later, the IEA’s June report still presumes that 510 million barrels of oil is still “missing”, and the IEA has officially opined that it all resides in the un-traded storage facilities in the developing countries of the world.
As the author of that analysis points out in another piece, those “un-traded storage facilities” being blamed were sometimes ridiculous notions, such as “slow-steaming tankers”, South African coal mines or even Swedish salt domes. In other words, the idea that there was this massive oversupply of oil production driving the almost 60% collapse in global crude prices in 1997 and 1998 was total bunk. Instead, what was driving prices lower was the simple fact of supply and demand balancing to achieve a physical clearingprice.
That meant, in the broader context far and away from Swedish salt domes, the price of oil was really trading on the collapse in global demand for it. The Asian “flu” was not simply a financial panic among “unimportant”, far-flung isolated economies of tiny nations, but rather a global slowdown across nearly every economy – to which sharply lower oil prices simply confirmed. Despite commentary of the dot-com bubble era, the US was not unaffected which is why Alan Greenspan’s FOMC cut the federal funds target rate from 5.5% to 4.75% between August and November 1998; a rather significant “stimulus.”
As if that was not enough of a parallel, there was also the “Saudi connection” then as now. Many respected observers put forth the notion, as they have in recent months, that the Saudis were behind the price collapse, or were using it to their advantage, seeking to squeeze out new producers. Back in the mid-1990’s that meant more expensive areas in Africa and new production capacity of the North Sea. The Economist published that idea in a March 1999 article titled, Drowning in Oil:
But low prices will gradually put most such areas out of business—especially if cash-strapped Gulf states conclude that the best way to increase revenues is to boost production, which could drive prices from today’s $10 to as little as $5 (see article). The world will then again depend on a few Middle Eastern countries for half its oil, up from a quarter now.
And so today, the Saudis are supposedly up to the same tricks, now trying to drive US shale production out of business. The fact that all those increased marginal suppliers more than survived the Asia flu tells you everything you need to know about this wild assertion of “intentional” Saudi action. It is a convoluted rumor that survives solely because it is convenient to those economists and commentators that refuse to accept these more basic connections.
That leaves us basically once more in the hands of Occam’s Razor, namely that oil prices are falling hard because demand is falling hard. The scale gives us insight into the nature of the slowing of the global economy, to which the US is a full part, meaning that comparisons only with past and serious downslopes is not a welcome development; nor should it be “unexpected.” Mainstream commentary seeks to reject this simple and basic argument because it cannot fathom, predicated on its penchant for nothing but parroting economic “authority”, that the world could fall so deeply into recession once more drowning not just in oil but also “stimulus.” Once you get past the idea that “stimulus” isn’t, logical sense is restored.
Jeffrey Snider via Alhambra Partners
9 Comments on "Occam’s Oil"
Makati1 on Fri, 2nd Jan 2015 3:59 am
As for the claim that demand is “falling hard”. BS! Prove it with real numbers sources OUTSIDE the US MSM Iron Curtain, like actual world wide export and import figures for the last 6 months.
Who gives a damn about US oil and the US economy? We know it is all lies and BS.
rockman on Fri, 2nd Jan 2015 7:34 am
M – But here’s the trick: what’s the typical metric for “demand”? Obviously almost everyone uses consumption. And though it’s still early the preliminary number are that demand hasn’t decreased much if at all. So no recession fueled decreases in demand causing lower oil prices, right? Hmm, maybe not right.
But that goes back to the demand of what we’re talking about. Today the demand for $60/bbl oil seems rather strong. And the demand for $90/bbl oil…not very much. Here’s a task for someone with a bit of time on their hands: plot another metric: price function demand…PFD: million bbls consumption/$ per bbl. So when prices were higher: PFD = 90 mmbbl/$95/bbl = 0.95. And today: PFD = 90 mmbbl/$60 = 1.5.
Here are some historical points. Using inflation adjusted oil prices, of course
http://inflationdata.com/Inflation/Inflation_Rate/Historical_Oil_Prices_Table.asp
1980: PDF = 0.59 ($107.37/bbl)
1985: PDF = 1.01 ($59.10/bbl)
1990: PDF = 1.59 ($47.79/bbl)
1995: PDF = 2.73 ($25.96/bbl)
2000: PDF = 2.05 ($37.55/bbl)
2005: PDF = 1.40 ($60.45/bbl)
2010: PDF = 1.14 ($77.11/bbl)
2011: PDF = 0.97 ($91.39/bbl)
2012: PDF = 1.01 ($88.95/bbl)
2013: PDF = 0.98 ($92.41/bbl)
1/6/14: PDF = 0.87 ($104/bbl)
1/9/14: PDF = 1.04 ($90/bbl)
1/1/15: PDF = 1.64 ($55/bbl)
Of course since the numbers aren’t out yet I had to assume consumption numbers for 2014 so I stuck with the last one we had: 90.4 mmbopd.
The obvious should be obvious: the higher the price of oil (adjusted for inflation) the higher the price of oil the fewer bbls per $’s spent. IOW PDF is 1 or less. And when prices go down PDF increase beyond 1. No big surprise there. But now hopefully someone with time will fill this metric out and post the global recessions on it and see if we see a similar (and perhaps more meaningful) relationship to the global recession cycle. Notice the lowest PDF (1980) proceeded the greatest recession since the great depression. And one of the highest (1995) preceded good economic times especially in the US. And what trend do we see starting in 2012: progressively lower PDF as we approached the oil price collapse. Just as we just saw starting in 2005 which proceeded the 2008 recession. So since 2011 matters held fairly steady around 1 but then began slipping and by the beginning of 2014 we were once again well below 1. And today…BAM!…way back up to 1.6. Which doesn’t necessarily mean we’ll see consumption increase in 2015. It takes time for the global economies to rebound. Remember in 2009 the world consumed less $58/bbl oil then it did $98/bbl in 2008.
Makati1 on Fri, 2nd Jan 2015 8:06 am
Does anyone actually know why prices dropped 50% in what, 6 months? Certainly demand has not dropped anywhere close to that, even at the $100 prices.
I have been reading so many (hundreds of articles) ‘theories’ these last few months that blame it on everything from politics to finances, to economies, to actual shortages. None seem to agree on any points except that the price has dropped. ALL seem to be flogging their favorite hobby horse or trying to sell something.
I guess we may know the results by the end of 2015 (or 2016) but maybe we will never know the real reason.
agramante on Fri, 2nd Jan 2015 8:56 am
That’s exactly it, Rock–during a recession, even though the price of a crucial commodity like oil might drop, people (and industries) have less cash to spend on it. At such time as they begin buying more, price can start to rebound. In a system as large and complex as the global economy there’s always lag time between any stimulus and its response, so you’ll always see a delay between a signal and its effect. I’m no economist–far from–but demand seems to me to be one of the most elusive things to track. And this whole question of the “missing barrels” simply highlights one of the fundamental issues in global economics and the market for oil: what numbers can we trust? Presumably, here in the US of A, we can place reasonably high confidence in the production data coming from wells across the country, because they’re individual wells, frequently not coordinated with many others, so fraud is much harder to perpetrate: there’s a higher degree of verifiability. But in the case of national producers like Russia or Saudi Arabia, as we all know, we have to take their numbers or leave them. Intelligence services which observe ports and count tankers can only accomplish so much. And likewise with the economic numbers: is China’s economy actually still growing, or are they really entering a recession, and unwilling to admit anything resembling the truth? Corollary stats like electricity production and credit applications have to serve as surrogates for overall economic activity and health. My own primitive Occam’s razor–and my conclusion is largely along the lines of this column–is that, such a large global decline in prices can’t be engineered by one player or a group of players: the price drop is too big and sustained. I do think it’s basic suppply-and-demand at work. Supply (C+C, anyway) has been reasonably steady, or ticked up a bit in recent years, but demand has clearly fallen off.
Kenz300 on Fri, 2nd Jan 2015 9:08 am
Selling oil for less than the cost of production……not a good business model.
High cost producers are shale, tar sands and deep water producers….. borrowing money for these ventures just got harder to come by.
shortonoil on Fri, 2nd Jan 2015 10:32 am
If one digs out Samuelson’s classic economics text, “Economics”, on about page 40 he states the theory (hypothesis) on demand, and supply. The demand curve slopes down, and to the right, the supply curve slopes up, and to the right. As price goes up demand goes down, and as price goes up supply goes up. This works for his example, cornflakes, but it doesn’t work for petroleum. Between 1960 – 2012 petroleum production (conventional crude) has increased 362%, while the price has increased 3,266%. Demand (what was consumed) has tracked the supply curve for the last half century regardless of the price. Demand has not gone down while price has been going up. Supply, and demand economics for petroleum has never worked, and it is not because of increasing population. World population between 1960 – 2012 increased 230%.
The reason supply/demand economics does not work for petroleum is because of depletion. Depletion not only means that as a commodity is extracted there is less, and less of it remaining, it also means that what remains will be more, and more expensive to extract. The analysts who continue to use supply, and demand to predict prices will continue to arrive at (most of the time) wrong answers. We use a method that has nothing to do with supply,and demand (since it obviously doesn’t work):
http://www.thehillsgroup.org/depletion2_022.htm
It has been 96.5% accurate for the last 54 years. Oil prices are now going down, and will continue to go down, and it has nothing to do with supply, and demand. However, we expect analysts to continue to predict oil prices based on it. When your only tool is a hammer, …….!
http://www.thehillsgroup.org/
Northwest Resident on Fri, 2nd Jan 2015 12:26 pm
For a long time, each barrel of oil extracted provided enough energy to pay for its own cost of extraction including repayment of the debt incurred to extract it — AND provided excess energy that enabled additional resource extraction and processing (economic growth).
Today, we are in a situation where each barrel of oil extracted barely pays for itself, if it does at all. And there is not enough excess energy left over after extraction to repay the debt incurred to extract it, and no excess energy remaining for additional resource exploitation and processing.
There is no way that this failing system will be able to continue for much longer. QE, ZIRP and massive financial manipulation can paper it over for a while and have been papering it over for quite a while now.
How much longer can the papering over continue before it just stops working?
Good question. A lot depends on how successful TPTB are in maintaining public confidence going forward. To do that, the illusion of “all is well” must be maintained.
But at some point, hard physical realities will break through the walls of denial in which that illusion is contained. Those realities have been beating against the walls of denial for some time, and the force is only growing stronger. The illusion of all is well and the public confidence that the illusion supports is about to be overrun by a million screaming realities that no sane person can deny.
Our entire civilization is under siege from a relentless army of stark realities, and the walls cannot long hold. It is going to be a slaughter when those walls come tumbling down.
shortonoil on Sat, 3rd Jan 2015 8:21 am
For a long time, each barrel of oil extracted provided enough energy to pay for its own cost of extraction including repayment of the debt incurred to extract it — AND provided excess energy that enabled additional resource extraction and processing (economic growth).
In 1960 it took 9% of the usable energy in the average barrel of oil to extract, process, and distribute it. In 2014 it took 75%.
“So long as oil is used as a source of energy, when
the energy cost of recovering a barrel of oil becomes
greater than the energy content of the oil, production
will cease no matter what the monetary price may
be.” M. King Hubbert
http://www.thehillsgroup.org/
Kenz300 on Sat, 3rd Jan 2015 9:17 am
I wonder hoy many bankers are regretting giving loans for some high cost projects……..
Will those loans be repaid?