Peak Oil is You

Donate Bitcoins ;-) or Paypal :-)
Page added on December 22, 2014
Bakken New Wells Producing Less Confirmed

It is has now been confirmed. The first measured 24 hour production from Bakken wells is a very good predictor of the future production of that well. And it has also been confirmed that new wells with higher well numbers are producing a lot less.
In the NDIC’s Daily Activity Reports they publish “WELLS RELEASED FROM “TIGHT HOLE” STATUS” as well as “PRODUCING WELL COMPLETED”. By searching these two lists, then eliminating the duplicates that appear on both lists, we find that perhaps 70 to 80 percent of all wells report their first 24 hours of measured production. It is listed as “BOPD” (Barrels Oil Per Day) and “BWPD” (Barrels Water Per Day). An example below, and notice the second well listed does not give any production numbers:

The “per day” in this case is the first 24 hours of measured production and not necessarily the first 24 hours of preduction. I have collected, from this source, the data from 2,565 wells dating from November 1st 2013 to the present date. Enno Peters gathered data from several thousand Bakken wells dating from the early Bakken t mid 2014. Using the well numbers, I have managed to match 1,127 wells in my database with the same well number in Enno’s data. There were a more matches than this but had no data or incomplete data. But it was mostly because only a little over half my data overlapped his.
From his data I used the 2nd and 3rd months production data because the first month’s data was often for less than one full month. I converted his monthly data to barrels per data by dividing the monthly data by 30.417. There were sometimes great anomalies in the data so to smooth things out, on the first three charts below, I used a 50 well average. Here are the results. The horizontal and right axis is first 24 hour barrels. The “First 24hr Barrels” is a smooth line because that was the sort column.
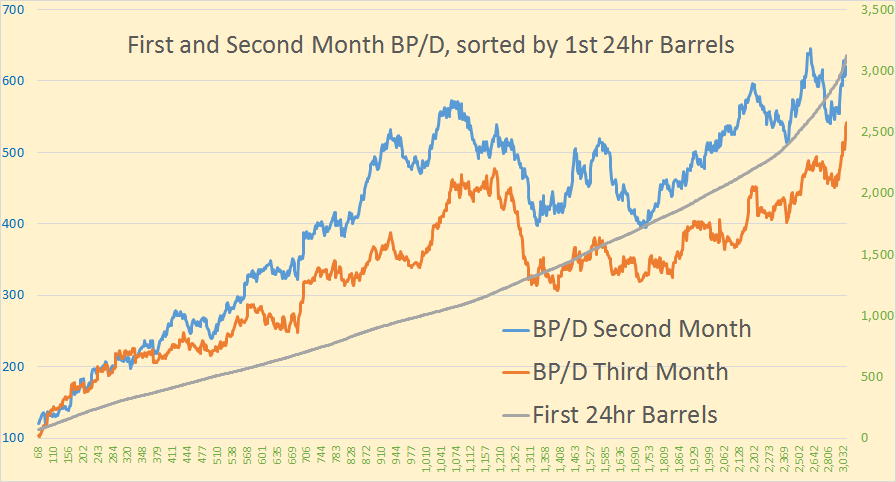
When I sorted the data by production in the first 24 hours I found a strong correlation with the second months production. This was especially true with first 24 hour production up to 1,050 barrels. The “First 24hr Barrels” chart line is smooth of course because that is the sort index.
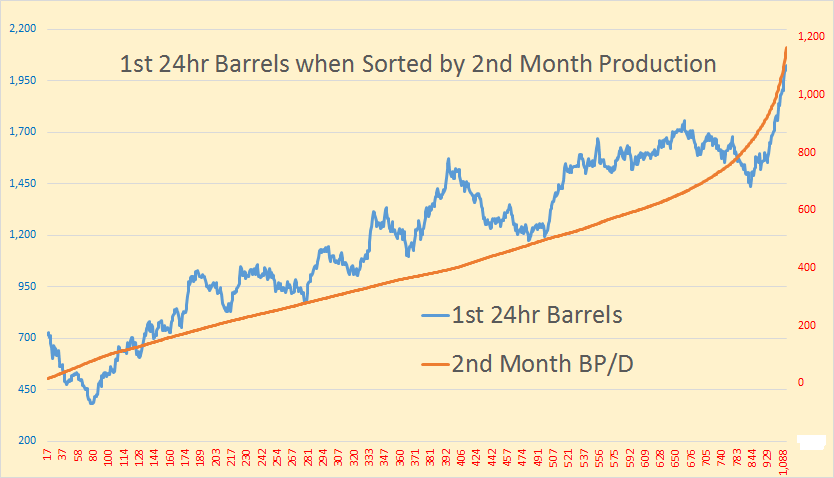
Sorting all wells by the second months production we see a very strong correlation to the first 24 hours of measured production.
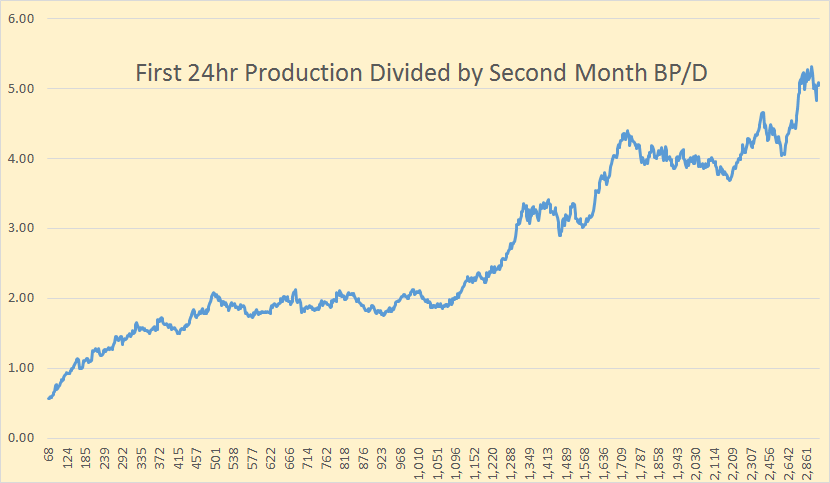
The Horizontal axis here is the first measured 24 hours of production. The vertical axis is the devisor needed to convert the first 24 hours production to second month barrels per day.
From this chart you can see that the conversion from the first 24 hour production to the second months production is non-linear. For instance if the first 24 hours production was between 50 and 1050 barrels then we could expect the second months production to be about half that. From about 1350 barrels to 1600 barrels the first 24 hours then the average second months production would be about one third that number. Or if the from 1700 to 2200 barrels the first 24 hours we could expect the second months production to be about one fourth that number.
The average second months production was 412 barrels per day while the average third months production was 328 barrels per day. This is a drop of 84 BP/D or 20 percent from the second to third months.
Enno’s data ends mid 2014. However I collected some data of my own from July and August 2014. If you go to NDIC Oil and Gas Production Report, you find data on all wells previously brought on line. Of the 1,127 wells in this sample, 87 or 7.7% had no third month production. Probably because they had not on been line long enough. Also 16 or 1.4% had a third months production but no second months production. This means the well was shut down that month. For all months with no production that cell was was left blank rather than incerting a zero. Therefore months with no production were not counted in any average. Blanks are not averaged, zeros are.
Enno’s data ends mid 2014. However I collected some data of my own from July and August 2014. If you go to NDIC Oil and Gas Production Report, you find data on all wells previously brought on line. The data is in this format:
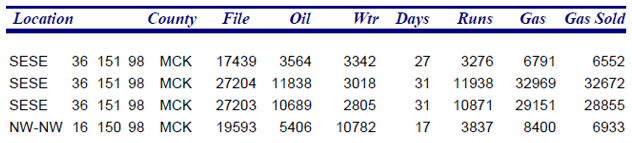
If you divide “Oil” by “Days” you get barrels per day for what I presume is the first month. I collected data on 332 from this source that matches well numbers from my “first 24 hour” data base from July and August 2014. This was a very time consuming process since each well number had to be searched then copied and pasted into my Excel spreadsheet, one well at a time.

The right axis as well as the horizontal axis is the 24 hour barrels sort number. The left axis is barrels per day. One can clearly see that the higher the 1st measured 24 hour production the higher the daily production for the next full, or nearly full, month. We can now say, with very strong conviction, that the first 24 hours of measured production will tell us just how well that particular well is likely to perform in the future.
I think this leaves little doubt that the BOPD number that the NDIC reports in their Daily Activity Report Index is a very good guide to what kind of future production we can expect from any particular well. However I must make one important point that I should have made a month ago when I first posted on “The First 24 Hours of Production”
I can find nothing that specifically states that the figure represented as “BOPD” above actually represents the first 24 hours of production. What I do know is that it is the first 24 hours of measured production. I think it is highly likely that they waited until a lot of the frack water had been pushed out before they started to measure. At any rate, based on the data I have researched above, it is definitely a useful guide to the future production of a particular well.
Now that the connection has been firmly established, let’s look at what that data is telling us.
This chart is all the wells listed by the NDIC with actual BOPD data from November 1st, 2013 through December 19th, 2014. There are 2,565 wells in this sample. Of course there were a few more wells than this but their first 24 hours of production was not published by the NDIC. What you see here is clearly the first 24 hours of production declining as the well numbers increase. However the decrease did not start until we were about half way through well numbers in the 25,000s.
First 24hr production was up and down until about well number 25600 then a steady decline set in. The highest 300 well numbers are averaging just under 1,000 barrels the first 24 hours. That translates to just under 300 bpd the second month if past first barrels at that level hold true in the future.
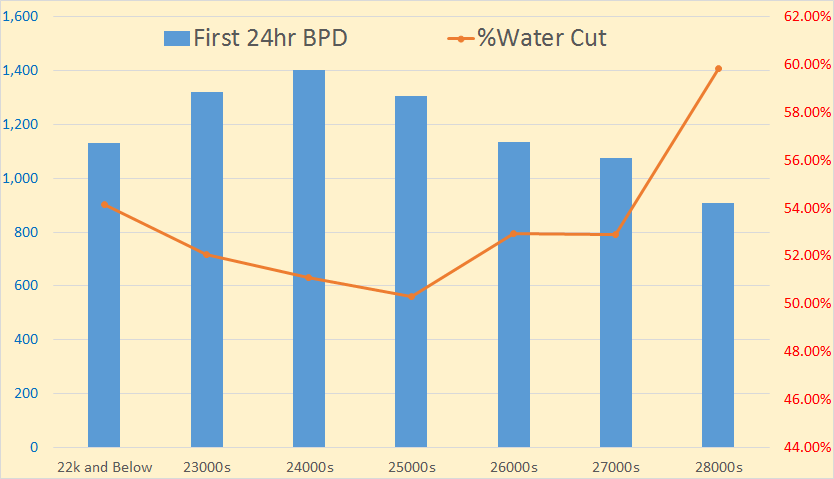
This chart shows the average first barrels per day for groups of well numbers. Below is the data for that chart along with the number of wells in each sample.
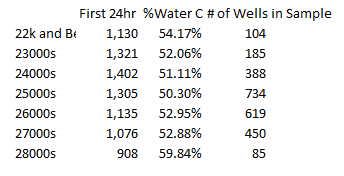
Wells in the 24000s were averaging 1,402 barrels of original production. The 28000 wells are averaging only 908 barrels the first 24 hours of measured production. That is a drop of over 35 percent. However there are only 85 wells with well numbers over 28000.
There are still some wells being drilled with low well numbers. Two wells are currently being drilled that are in the 21000s. And 27 wells are currently being drilled below the 27000s or below. But 153 of the 180 wells being drilled, (181 if you count the salt water disposal well), or 85 percent of wells being drilled are in the 28000s or above. 105 of 180 wells are in the 29000 or above. 3 are in the 30000s.
Where in the past, though some wells with numbers above 27000 were being drilled, the majority of wells were below that number. Therefore no obvious decline in monthly well production could be gleaned from the numbers. Only when the wells are sorted by well number does the decline become apparent. But that is all about to change because most of the choicest places have already been drilled.
It is important to remember that wells are not drilled in permit number sequence. There are always far more permits issued and awaiting the driller than wells being drilled.
It is unclear, to me anyway, whether the lower production per well is because of downspacing, moving further away from the sweet spots, or both. But it is clearly happening. Newer wells, or at least those with higher permit numbers, are definitely coming in with lower production numbers.
In 2015 we will see the squeeze coming in from two sides, fewer wells being drilled and lower production from those that are being drilled. It is my prediction that the Bakken will peak in 2015. In which month it will peak is hard to guess.
But there is a third squeeze, from another side. The junk bonds that many small shale drillers depend on for their financing are dropping through the floor. That means yields are going through the roof.
U.S. shale junk debt tumbles amid oil crunch
HOUSTON – Prices for the risky corporate bonds that have fueled the U.S. shale energy boom are plummeting as oil prices have fallen below $60 a barrel for the first time in more than five years.
The U.S. energy-sector’s high-yield bond prices, known as junk bonds because they carry high risk for investors, have dropped 18.9 percent since the end of June to the close of trading Friday – putting the sector on track for its worst performance in returns since the financial crisis of 2008, according to Barclays…
Prices for the entire spectrum of U.S. corporate bonds have tumbled 7.7 percent since June, and are also set to perform worse than any year since the U.S. credit crunch six years ago, according to Barclays…
The sharp selloff comes as a handful of small oil companies are approaching or have exceeded 20 percent yields, analysts with Tudor, Pickering, Holt & Co. said in an investor update Monday.
Twenty percent, imagine that! How long can any driller afford to rollover any debt at those rates? With very low oil prices, less production from their new wells and the cost of new money at unheard of rates… they are sunk!
Note: This will be my last post until sometime after Christmas. If would like to get on the notification list of new posts please email me at DarwinianOne at Gmail.com.
18 Comments on "Bakken New Wells Producing Less Confirmed"
buddavis on Mon, 22nd Dec 2014 8:21 am
I would like to see how number of stages have increased over time and the size of the frac has increased over time. It could sharpen the decline, IMO, depending on how sharp the increases were.
Plantagenet on Mon, 22nd Dec 2014 8:59 am
Good work on the number crunching. I’m glad to see you took my advice and have shifted your focus away from the barrels of water data to the more important and more telling barrels of OIL numbers. Given the high rates of declines seen in shale oil production the initial production values are, of course, excellent predictors of total oil production from a well. Your finding that initial production is declining is strong evidence that the “sweet spots” are about used up in the Bakken. Good job!
rockman on Mon, 22nd Dec 2014 9:25 am
Bud – And that’s the problem I have looking at the change in Eagle Ford production over time. OTOH lesser potential leases will often be drilled I the later stages of a trend’s development but that stat would be clouded by longer laterals and more frac stages. Comparing a well drilled 3 years that had a lateral of 2,500′ with 8 frac stages will perform differently from one with a 5,000 lateral with 36 frac stages. And now EOG is doing 80+ frac stages in a single well with a massive amount of sand.
With a significant amount of digging I can find lateral lengths. But no readily available public data base for the number of frac stages in a particular well.
Terrific numbers indicating the shift in the play. Even more telling will be the the change in the first 12 months cumulative production with regards to the potential for lower URR of more recent wells.
bobinget on Mon, 22nd Dec 2014 9:32 am
” A new study shows that the “water cut” which is the amount of water that comes up the well with the oil is increasing in the Bakken. The water cut normally increases as wells age, but in the case of North Dakota, the percentage of water that is showing up with the oil is increasing in newly drilled wells. This suggests production from the “sweets spots” which contain the highest oil saturation is declining as a share of the total oil coming from new wells”.
http://www.resilience.org/stories/2014-12-22/peak-oil-review-dec-22
OFT on Mon, 22nd Dec 2014 10:44 am
Rockman, Bud and others – Reading in ‘Upstream’ weekly paper, I see that they report some shale gas production in ‘MMcf per 1000 foot per day’, to try and give a guide on productivity per fixed distance of completion.
Now that does not indicate number of frac stages, but it does shed more light on the relative productivity.
Is similar info being thrown around in oil plays and reports elsewhere?
Nony on Mon, 22nd Dec 2014 11:39 am
Rock, in the Bakken, the number of stages and pounds and type of proppant is public.
Speculawyer on Mon, 22nd Dec 2014 11:45 am
Very interesting. As mentioned by several already, this seems to indicate that they are running out of ‘sweet spots’ and moving to less productive areas.
We could be in for a big whipsaw effect and the price of oil may eventually rise much faster than people predict due to a combination of increasing demand from economies doing better, reduced production due to reduced investment/drilling, and reduced production due to lower quality locations.
I just hope that people are smart and buy fuel efficient (and preferably plug-in) cars during this oil drop. People that buy gas-guzzlers may find themselves in trouble if gas prices rise within a few months are years. Especially if they buy with a long-loan that may end up underwater.
Apneaman on Mon, 22nd Dec 2014 12:07 pm
Sounds like most of the low hanging fruit has been picked and the shale “revolution” has fizzled out. Vive la frack! Vive la frack! —–NOT
rockman on Mon, 22nd Dec 2014 12:18 pm
Nony – “…in the Bakken, the number of stages and pounds and type of proppant is public.”. Excellent. What sort of trend, if any, can you document for the last few years?
antaris on Mon, 22nd Dec 2014 1:21 pm
Spec. I have driven a fully electric car for 3 years now. When people ask me about it and I ask them about their thoughts on oil, it becomes clear the people have no concept of what has made it possible for them to be born and live in this world. When the price of oil drops I am sure most people will forget about efficiency. Nobody seams to equate oil with survival in our world.
Nony on Mon, 22nd Dec 2014 1:22 pm
Rock: the quick honest answer is “I don’t know”. 😉
The longer BSing answer [all based on Googling, not me doing calculations from the database…I don’t have the subscription, am lazy, don’t work for free, etc.]:
Stage count is up (even normalized by lateral length) from ~3 to ~30 over the last few years. It appears to have stabilized though. Total proppant/ hole is clearly up (even normalized by lateral length) but may be down per stage.
https://www.google.com/search?q=trend+of+stage+count+and+proppant+amounts+north+dakota#q=trend+of+stage+count+and+proppant+amounts+north+dakota&tbas=0
(see in particular, the Schlumberger white paper and the Oil and Gas Reporter summary of work from Colorado School of Mines)
rockman on Mon, 22nd Dec 2014 1:31 pm
OFT – “‘MMcf per 1000 foot per day’, to try and give a guide on productivity per fixed distance of completion.’. First, no: length won’t necessarily correlate to frac stages. Two wells may have 5,000’ laterals and one gets 16 stages and the other get 32 stages. And it isn’t just the number of frac stages but also where they happen and how much proppant in each. And then not all frac stages in a well perform like each other. You might plan to pump X thousand # of proppant in each stage. Some get X thousands #’s in and some only get 30% of X thousands #’s in before it “screens out”…won’t accept anymore proppant.
More complications: two 5,000’ laterals…one cut 3 natural fractures and the other cuts 6. Usually the more natural fractures the better the production. And then you pump 24 frac stages into each well. In the well with 3 natural fractures the frac jobs reaches out and cuts 20 natural fractures while the other well has only 8 natural fractures cut by the frac stages. More complications: in the well cutting 6 natural fractures those cracks don’t extend very far and drain only about 10 acres. But the 3 natural fractures in the other well extend a great distance and drain 30 acres. More complications: I might pump 250k # of sand into the eagle Ford formation in my well but instead of going into the EFS it travels up alone the outside of the bore hole I drill and goes into the nonproductive formation sitting just 100’ about the EFS.
Remember what you see at the surface while you applying all this high tech: you doing it all thru a section of pipe that might be less than 5” in diameter and sometimes less than 3”. And you have a variety of meters indication pressure and the volume of frac fluid an proppant you moving. Other than that you can’t see what’s happening 2 or 3 miles at the other end of that piece of pipe. Such stats as MMCF per 1,000’ or X bo per 1,000’ of lateral will always be an interesting metric and very easy to compute. But the implications can be very difficult to interpret. And often impossible.
rockman on Mon, 22nd Dec 2014 1:35 pm
Nony – Exactly. LOL. That’s why I chose my words carefully: “…readily available public data base…”. I could access all that info from the TRRC data base but it would take 1,000’s of hours just to develop a small output.
As you imply: I would do it…if someone paid me to. LOL. In the meantime we’ll just have to trust he numbers others cook up.
dolanbaker on Mon, 22nd Dec 2014 4:44 pm
“Apneaman on Mon, 22nd Dec 2014 12:07 pm
Sounds like most of the low hanging fruit has been picked and the shale “revolution” has fizzled out. ”
I wouldn’t exactly call shale fracking `low hanging`, more like a tall stepladder hanging, we’re gonna soon need a longer ladder. 😉
Nony on Mon, 22nd Dec 2014 7:52 pm
Ron has a tendency to trumpet things early and in the peaker direction. I still remember him misinterpreting the RRC data as declines when he did not understand how updates occur for 24 months. All that said, it is reasonable to expect a rought correlation of IP to cum (as shown in DC’s regression). And to expect a correlation of number to time.
All that said, Ron has a tendancy to run too early…especially when the data fits the peaker meme. I would feel better if the yearly cums by Enno showed what Ron is trying to show. For instance not clear to me if there is a seasonality issue if he just goes off of last few months’ data.
NOt saying he won’t be confirmed. Just not so BOLD LETTERS AT THE FRONT certain as he is.
Nony on Mon, 22nd Dec 2014 7:56 pm
http://peakoilbarrel.com/texas-rrc-monthly-update/
This is the Ron screwup that I reference. And he never really manned up with an “I was wrong”. Especially about comments like this:
“Now I know most will say that the RRC data will be revised upward. Yes it will but I think most revisions after the first month will be negligible.”
Norm on Mon, 22nd Dec 2014 10:57 pm
What’s funny is, in 4 billion years the sun goes supernova and when it does, all those bore holes will still be in all those rocks. Even though
people and their Lincoln Continentals have been dead for 4 bjllion years. Then intelligent life has to evolve on some other planet, since it never evolved here.
Nony on Tue, 23rd Dec 2014 9:23 am
D Coyne has an analysis up showing a slight up-trend in 6-month cums.
P.s. Ron is really funny with the bold at the top of his article. “I am confirmed” blabla. This is going to turn out like his RRC screwup that he never manned up and took responsibility for. That Roger Blanchard never took responsibility for.