
North Dakota production by county is posted here: ND Historical Barrels of Oil Produced by County Confidential wells are not included in that data however but that estimated data can be found here:Monthly Production Report Index Click on the latest month.
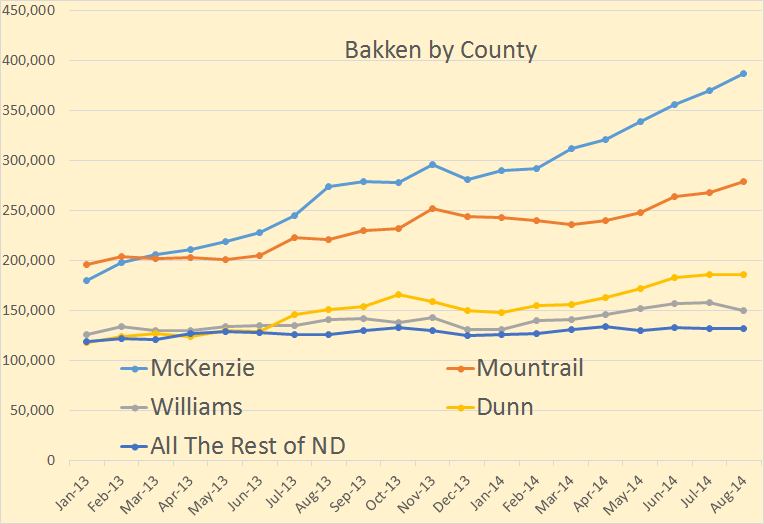
This is a zero based chart and gives a better overall picture of production from each county. The charts below are not zero based but gives an amplified picture of production from each county.
Production in barrels per day for each county was as follows:
McKenzie 386,715
Mountrail 278,940
Dunn 185,707
Williams 149,437
Rest of ND 131,531
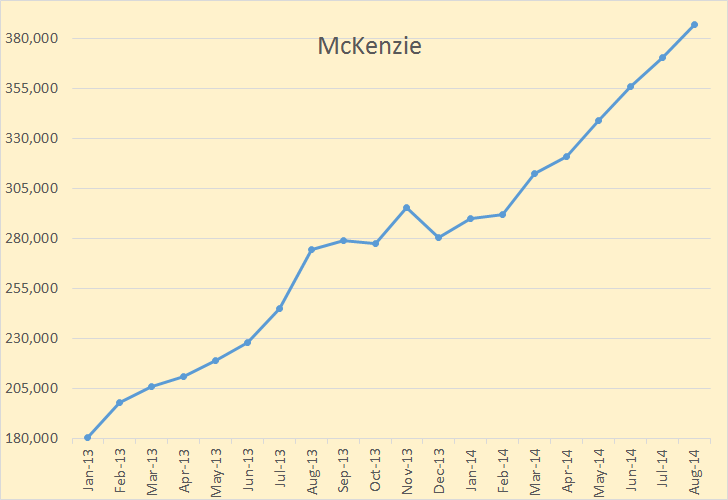
McKenzie county production was up by 16,435 barrels per day. McKenzie remains the most productive county in North Dakota.
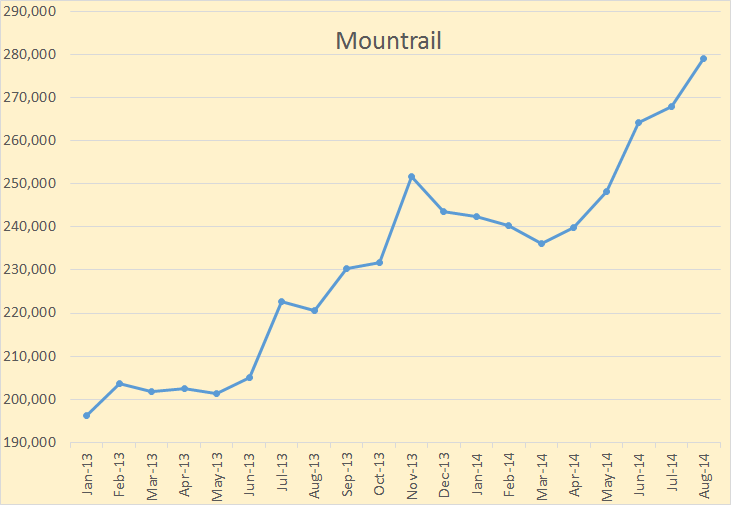
Mountrail county was up by 11,077 bpd. A surprisingly good month for that county.
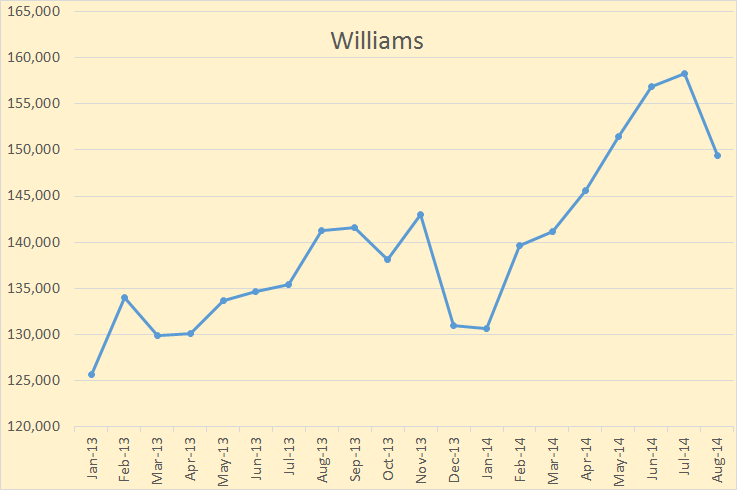
Williams County production was down 8,827 bpd. Quite a large drop. I have no idea what is happening there.
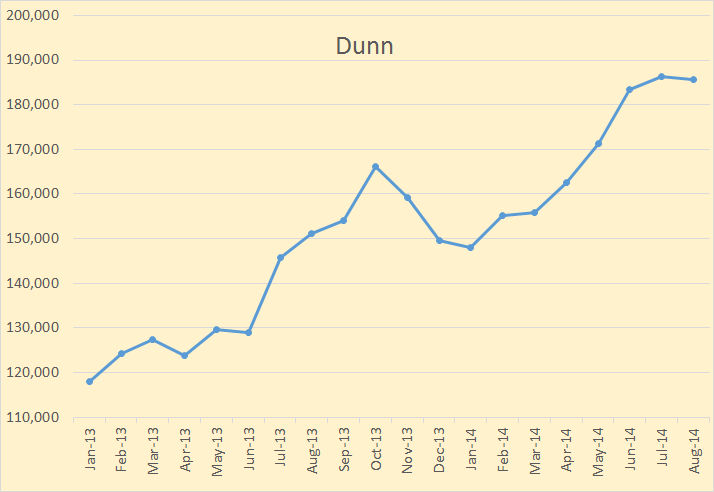
Dunn County was down 550 bpd.
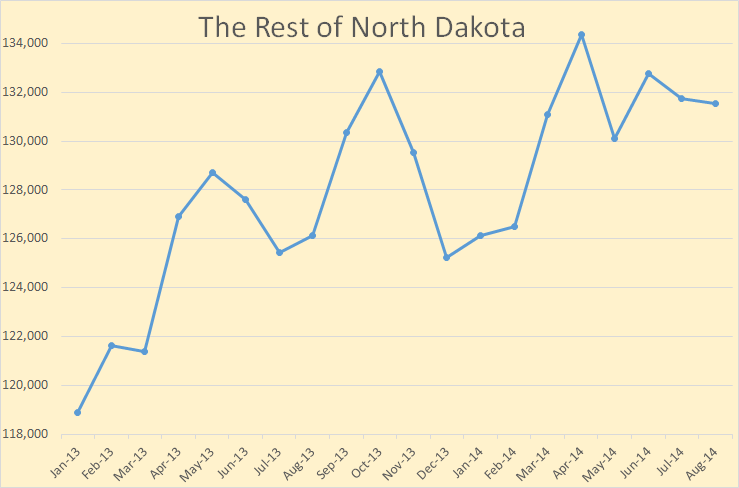
All the rest of North Dakota was down 225 barrels per day.
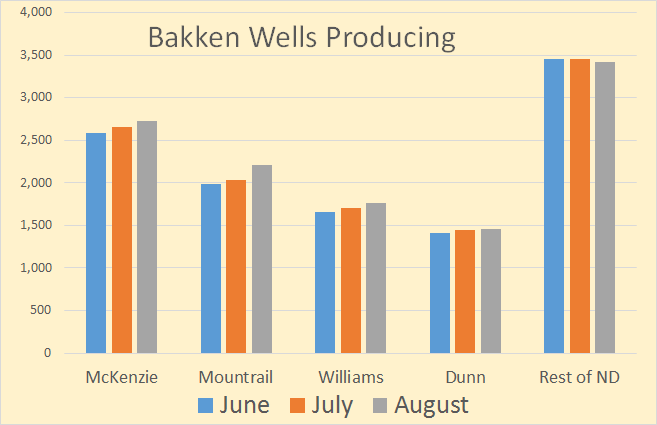
Bakken wells producing in August was:
McKenzie 2,731
Mountrail 2,204
Williams 1,757
Dunn 1,454
Rest of ND 3,417
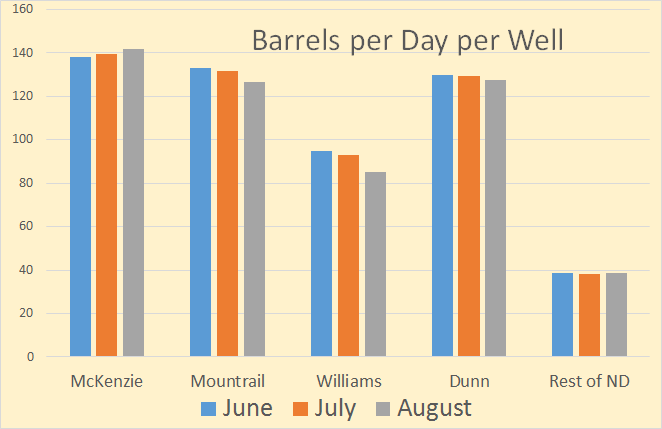
Bakken barrels per day per well in August was as follows:
McKenzie 142
Mountrail 127
Williams 85
Dunn 128
Res of ND 38
The North Dakota rig count is given every Monday by Bakken Shale but the same data can be gleaned from here, Current ND Active Drilling Rig List three days earlier, Friday evening around 7:00 PM. The number of rigs is not listed but t list can be copied and pasted into Excel, then just read the last line number.
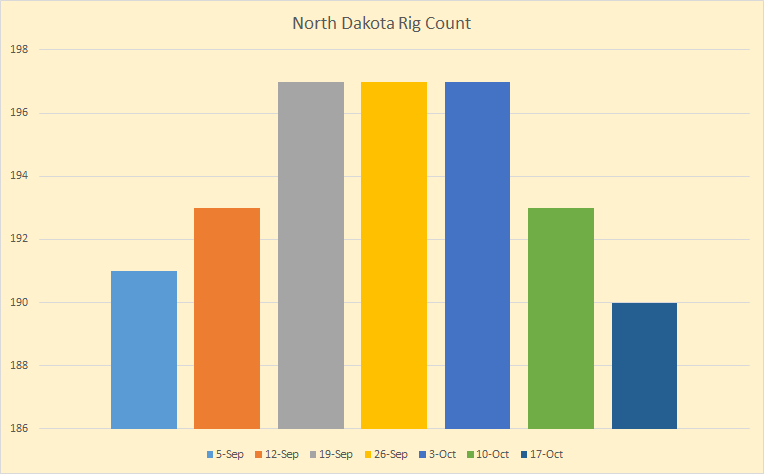
The North Dakota rig count hit about a two year high September 19th at 197, held that level for three weeks but has dropped by 7 in the last two week. The rig count will be the thing to watch over the next few months to see if the low oil price is having any effect on drilling. There will be a several month time lag in oil production but there is no time lag in rig count, we know the very week it happens.
The US drilling rig count declined 12 units to settle at 1,918 rigs working during the week ended Oct. 17, Baker Hughes Inc. reported. That number will bear watching also.
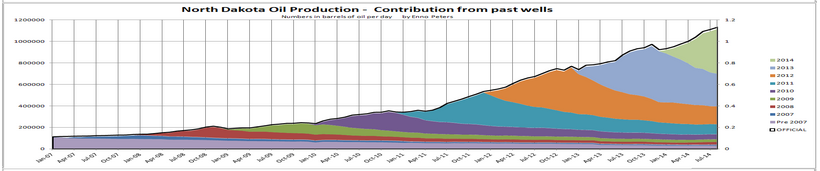
Enno Peters posted this chart two Thursday. Notice the decline rate of all wells drilled prior to this year.
Note: I send an email notice when I publish a new post. If you would like to receive that notice, or talk to me about anything else, then email me at DarwinianOne at Gmail.com
rockman on Mon, 20th Oct 2014 11:53 am
Folks should really look close at that last curve. It’s an excellent graphical representation of the fact that others have tried to express: without continued drilling the production from ND would drop very quickly. And in general the Bakken wells don’t decline as fast during the later phase of the lives as do the Eagle Ford Shale wells.
Northwest Resident on Mon, 20th Oct 2014 12:11 pm
And the moral of the story is:
1) Without continued drilling, Bakken and other shale play output will drop like a rock
2) Without a constant stream of new investment bucks, continued drilling will screech to a halt
3) Without QE (Fed creating new trillion$), the constant stream of new investment bucks will dry up quickly
That’s it. End of the road. All “growth” and all oil production increases have been bought with DEBT these last several years — probably since 2005. Now the ability to create even more debt (QE) is running up against a brick wall.
No more debt. No more “growth”. The fat lady is singing right now. Next up: the curtain comes down, the lights go out — the show is over.
Davy on Mon, 20th Oct 2014 12:40 pm
NR, it is starting to feel like that BAU coaster has made it to the final climax run before we pull into the station. Only problem there is no getting off. They can still jawbone the markets and there is no food or fuel shortages. They have some time but it appears the temporary control they had since 2008 is slipping from their grasp. Your 2015 predictions may yet show validity.
Northwest Resident on Mon, 20th Oct 2014 1:00 pm
Davy — I will get no joy or satisfaction whatsoever if my end-of-BAU 2015 prediction comes true.
We all know, or should know, that BAU was within a gnat’s ass of crashing back in 2007/2008. The ONLY thing that prevented that was massive injections of liquidity — QE — combined with interest rate lowering.
Essentially, the global economy has been on life support since 2007/2008, with that IV drip line pumping trillion$ and trillion$ into the economy to hide the deep cracks and mortal wounds.
Since 2007/2008, the financial realities we all used to know and take for granted have been thrown out the window. It has been a crazy game of manipulation and fraud and lies and propaganda since then, all intended to just stretch out that last act of BAU dying for a little while longer.
No more QE and interest rate increases equate directly to “end of life support”. To me, that is secret code word for “grab your butts, cash out now and head for the hills”. It is the same as admitting that the game is over, the grand spectacle we have all been treated to these last several years is winding down.
It is pretty obvious. Hard to accept. Difficult to force oneself to accept that reality, perhaps. But what we have logically and intellectually accepted as truth for all these years is now becoming reality, just like we knew it would.
Definitely not a time for smug satisfaction or “I told you so” — more like a time for weeping and gnashing of teeth, to put it in Biblical terms.
JuanP on Mon, 20th Oct 2014 3:44 pm
I completely agree with rockman’s, NR’s, and Davy’s comments. I think Bakken oil production may peak before winter and never recover from this next winter’s if oil prices continue this low.
The oil companies reduced cash flow will go to pay dividends and debt payments, leaving little money, if any, for operations.
Northwest Resident on Mon, 20th Oct 2014 3:54 pm
JuanP — Not to beat a dead horse (or is that kick a dead dog), this article recently posted makes many of the same points being made in the comments and article above, from a slightly different angle:
Houston, We Have A “Fracking” Problem
“The oil and gas sector is capital intensive. Drillers have borrowed phenomenal amounts of money, which was nearly free and grew on trees, to acquire leases and drill wells and install processing equipment and infrastructure. Even as debt was piling up, the terrific decline rates of fracked wells forced drillers to drill new wells just to keep up with dropping production from old wells, and drill even more wells to show some kind of growth. One heck of a treadmill. Funded in part by junk debt.
Junk bond issuance has been soaring as the Fed repressed interest rates and caused yield-hungry investors to close their eyes and take on risks, any risks, just to get a teeny-weeny bit of extra yield. Demand for junk debt soared and pushed down yields further. And even within this rip-roaring market for junk bonds, according to Bloomberg, the proportion issued by oil and gas companies jumped from 9.7% at the end of 2007 to 15% now, an all-time record.”
ht tp://streettalklive.com/index.php/blog.html?id=2457
JuanP on Mon, 20th Oct 2014 4:01 pm
I followed the link https://www.dmr.nd.gov/oilgas/stats/countymot.pdf to ND historical oil production by county to check how the individual counties were doing.
My interpretation of that data is that there are only three counties where the oil production is still increasing in North Dakota. These counties are McKenzie, Mountrail, and Williams. In McKenzie production seems to be clearly growing, but in the other two we may be at peak, as I read the data, though we will only be certain in hindsight.
That means ND oil production growth is potentially restricted now to its last and most important county, McKenzie. When McKenzie peaks, oil production in ND is likely to stop growing and start contracting immediately.
The moment is getting close and lower prices will bring it forward.
rockman on Mon, 20th Oct 2014 5:49 pm
“I think Bakken oil production may peak before winter…”. Perhaps…maybe not. Just depends on what is still worth drilling. But there will be a geologic peak regardless of higher oil prices. I jumped though the article so I might have missed their logic of focusing on those few counties. A simple reason: of all the counties under which the Bakken formation exists that’s where the bulk of the better wells were drilled.
And what we’re beginning to see is the decline of remaining VIABLE undrilled locations in those cpunties. Which emphasizes the ignorance of many pundits who divided the entire area of the Williston Basin by the typical size of a Bakken drilling unit to predict the future number of wells and thus production. And how dd the oil patch know to focus on those counties? Before the recent boom vertical wells had been drilled for 50 years and provided that focus. As mentioned before the oil patch is good at targeting the “sweet spots”. Especially when we have HALF A CENTURY of history.
A couple of years go an unsuccessful Bakken well was drilled. So did the Bakken test poorly in that well? No, it didn’t. Because the Bakken wasn’t even tested in that well because the formation didn’t exit in that area of the basin.
Nony on Mon, 20th Oct 2014 8:07 pm
Enno has a chart showing cum curve by year group. The recent wells are not getting worse (getting slightly better). That’s not “running out of sweet spot”.