Peak Oil is You

Donate Bitcoins ;-) or Paypal :-)
Page added on July 3, 2014
EIA World Crude + Condensate Production Update

The EIA updated their International Energy Statistics Monday with their January update. I spent several hours on that update, updating all my spreadsheets, updating the Non-OPEC Charts page, the World Crude Oil Production by Geographical Area page, and creating the post below. Then after I had finished all that they, the EIA, published another International Energy Statistics with the February production data. Sorry but I am exasperated, I will deal with the February update sometime next week. Below is what I prepared before that update. Anyway the emphasis is far more on the yearly numbers than the monthly numbers.
+++++++++++++++++++++++++++++++++++++++++++++++
The EIA finally published an update to their International Energy Statistics. They were over a month late. Last time they were a month late they published two months data. This time no such luck, the data is through January 2014. There was only large revision in the historical data, Canadian December Production was revised up by 298 kb/d. There were several much smaller revisions but World December production was revised up by 273 kb/d to 75,431,000 bp/d in December.
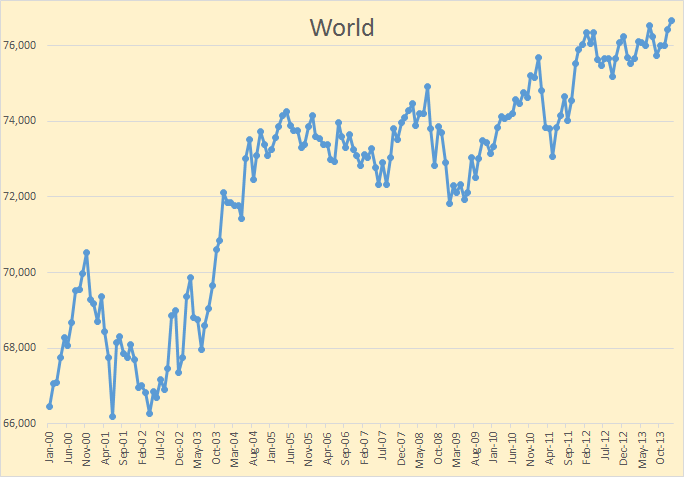 World C+C was up to 76,662,000 barrels per day, an increase of 231 kb/d over December. Average world C+C production was up only 132,000 bp/d in 2013 over 2012.
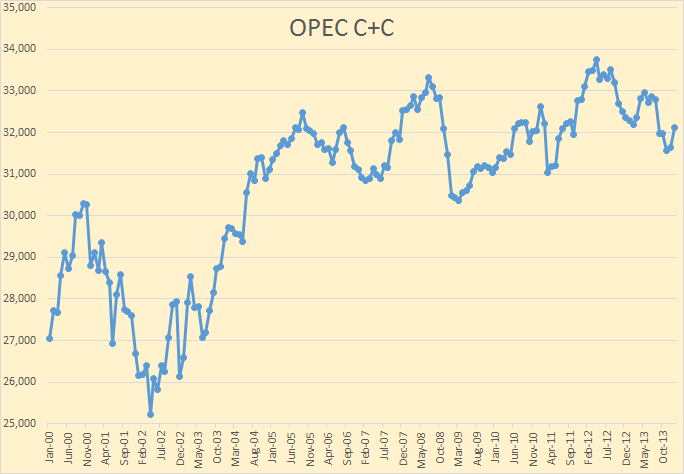
The Gain was all OPEC however. January OPEC Crude + Condensate production was up by 482,000 bp/d to 32,118,000 bp/d. This is considerably different from what the OPEC Monthly Oil Market Report reported. They had OPEC crude only production up by 147,000 bp/d in January to 29,855,000 bp/d. Understand this is crude only, not C+C. OPEC crude only seems to be holding relatively steady and stood ate 29,765,000 bp/d in May.
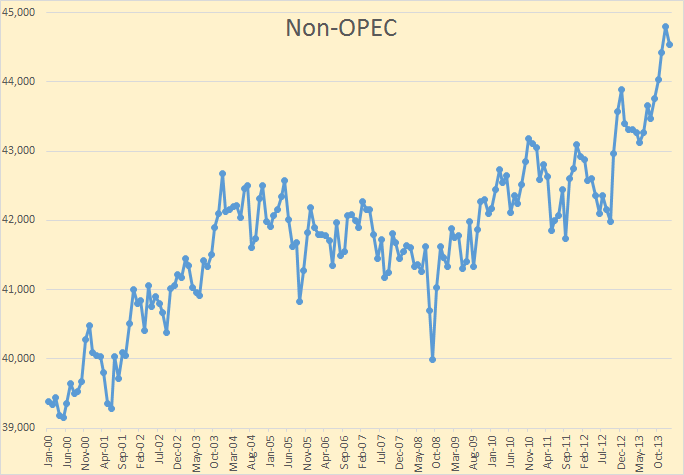
Non-OPEC C+C production was down by 251,000 bp/d to 482 kb/d to 44,544,000 bp/d in January after reaching a record high of 44,795,000 bp/d in December. With the revisions for Canada Non-OPEC C+C production was up 958 kb/d in 2013. US production was up 962 kb/d in 2013 so all the increase was due to US production. Total World C+C production was up 132 kb/d in 2013 so without the gain from the US total World C+C production was down 830,000 barrels per day in 2013.
Only two countries are showing continuing increases year over year, the US and Canada.
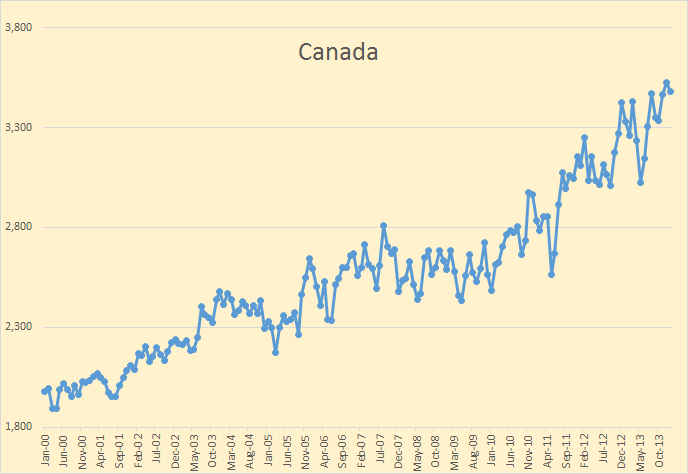
Canada will likely continue to show a slight year over year increase for a few more years then level off. However Canada is the only country that shows such promise.
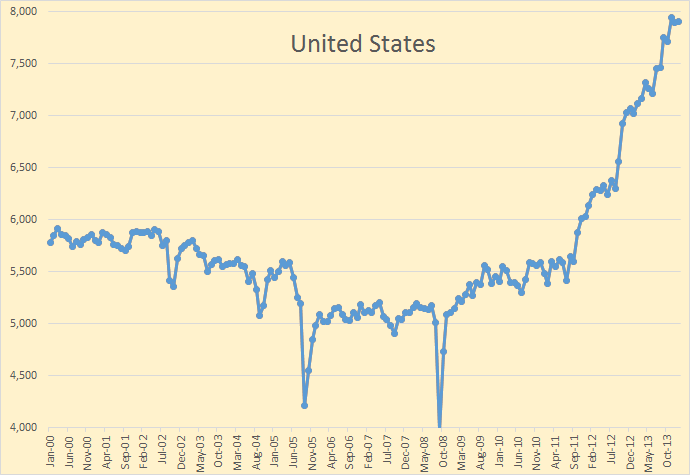
By far the largest increase in production has come from the United States. Peak Oil or no Peak Oil, it is all rides on production from the USA.
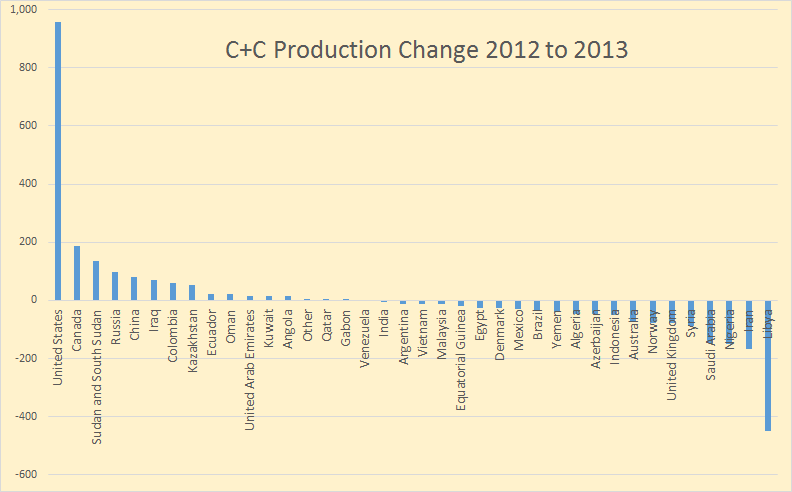
This chart demonstrates that story in spades. Of all the top gainers on this chart, only Canada will continue to increase for any length of time. All the rest, with the possible exception of Kazakhstan, will either plateau or decline in the next two or three years. Most will actually decline.
This chart represents 100% of all World production. All the small producers are combined under the titled “Other”.
Of countries that increased other than Canada and the US, Sudan and South Sudan was just recovering from political conflict. They still have some recovery to go but that could go either way. Russia, I believe, has peaked. Their average production this year will likely be very close to the 2013 average but they peaked in December and the trend is clearly down.
China and Colombia both show signs of peaking and who knows what will happen in Iraq. But Iraqi production will very likely suffer due to the conflict there.
Libya and Iran may recover but continuing political unrest will likely offset any recovery by them.
I know I have made this point many times before but I must do it again. The World less USA has already peaked. Only shale oil production from the USA is keeping the world from peak oil. But even with almost 1 million barrels per say increase from the USA world oil production was up a measly 132 kb/d in 2013. The USA does not have to peak for the World to peak, it only has to slow down slightly.
It looks like world C+C will peak either in 2014 or 2015 at the latest.
The page Non-OPEC Charts has been updated with the January data for all charts.
Also the page World Crude Oil Production by Geographical Area has been updated with the January data.
5 Comments on "EIA World Crude + Condensate Production Update"
Plantagenet on Thu, 3rd Jul 2014 5:20 pm
Its premature to say the World w/o the USA has already peaked. Production in the US is surging due to fracking. Lets wait and see what happens as fracking begins to be used in other countries outside the USA.
GregT on Thu, 3rd Jul 2014 8:46 pm
“The USA does not have to peak for the World to peak, it only has to slow down slightly.”
The USA peaked 40 years ago, but why let facts ruin a good delusion. Also, for the illiterate among us, fracking too will peak, much faster than conventional oil did.
dashster on Thu, 3rd Jul 2014 9:36 pm
Those graphs don’t appear to support the contention that conventional crude oil production peaked in 2005. Neither Canada and their tar sands, nor the US and their fracking were up in 2008, and yet 2008 production was higher than 2005.
dashster on Thu, 3rd Jul 2014 9:38 pm
“so, for the illiterate among us, fracking too will peak, much faster than conventional oil did.”
The writing was talking about the peaking of US fracking.
Meld on Fri, 4th Jul 2014 1:56 am
wait until the graph changes to Crude + Condensate + Dust Production and that graph will keep on going up and up and up