Peak Oil is You

Donate Bitcoins ;-) or Paypal :-)
Page added on July 2, 2014
World Energy 2014-2050 (Part 2)
")
Nuclear Electricity
According to BP Statistical Review of World Energy 2014, world consumption of nuclear electricity reached 2,489 terawatt-hours (563 million metric tons of oil-equivalent) in 2013, 0.9 percent higher than world consumption of nuclear electricity in 2012. In 2013, nuclear electricity accounted for 4.4 percent of the world primary energy consumption.
Figure 16 shows nuclear electricity consumption by the world’s five largest nuclear electricity consumers from 1965 to 2013.
According to the World Nuclear Association, as of January 2014, 375 gigawatts of nuclear electric power plants were operative worldwide. 75 gigawatts were under construction, 187 gigawatts were being planned, and 351 gigawatts were being proposed. World Nuclear Association claims that most planned nuclear power plants are expected to operate within 8-10 years. Assuming that in 10 years, all of the currently constructed and planned nuclear power plants become operative, then in average the world will need to build 26 gigawatts of nuclear power plants a year in the next 10 years. In reality, some delays are inevitable.
I assume that from 2015 to 2050, the world will build 20 gigawatts of nuclear power plants each year. On the other hand, 2 percent of the existing nuclear generating capacity will retire each year. Under these assumptions, nuclear electricity consumption is projected to rise to 4,648 terawatt-hours (1,052 million metric tons of oil-equivalent) by 2050.
Hydro Electricity
According to BP Statistical Review of World Energy 2014, world consumption of hydroelectricity reached 3,782 terawatt-hours (856 million metric tons of oil-equivalent) in 2013, 2.9 percent higher than world consumption of hydroelectricity in 2012. In 2013, hydroelectricity accounted for 6.7 percent of the world primary energy consumption.
Figure 17 shows hydroelectricity consumption by the world’s five largest consumers of hydroelectricity from 1965 to 2013.
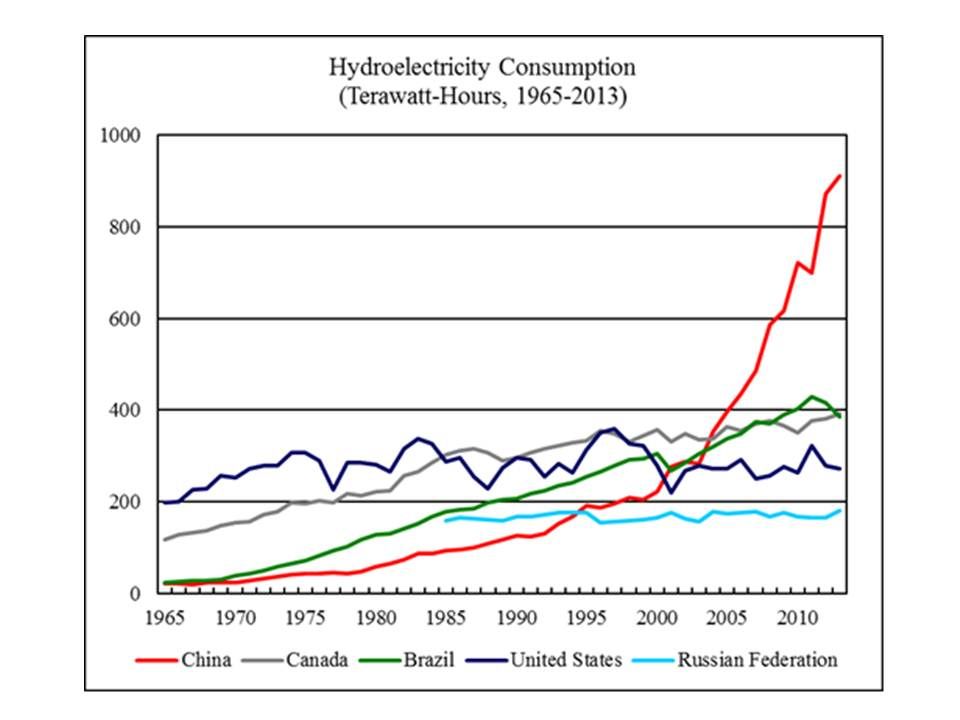 From 2000 to 2013, the average annual growth of world hydroelectricity consumption was about 90 terawatt-hours (20 million metric tons of oil-equivalent). I assume that world hydroelectricity consumption will rise to 880 million metric tons of oil-equivalent in 2014 and will keep growing by 20 million metric tons of oil-equivalent each year from 2015 to 2050.
Wind Electricity
According to BP Statistical Review of World Energy 2014, world consumption of wind electricity reached 628 terawatt-hours (142 million metric tons of oil-equivalent) in 2013, 20.7 percent higher than world consumption of wind electricity in 2012. In 2013, wind electricity consumption accounted for 1.1 percent of the world primary energy consumption.
In 2013, the world cumulative installation of wind power capacity reached 320 gigawatts, 12.4 percent higher than the cumulative installation in 2012. Figure 18 shows the cumulative installation by the world’s five largest installers of wind power capacity from 1997 to 2013.
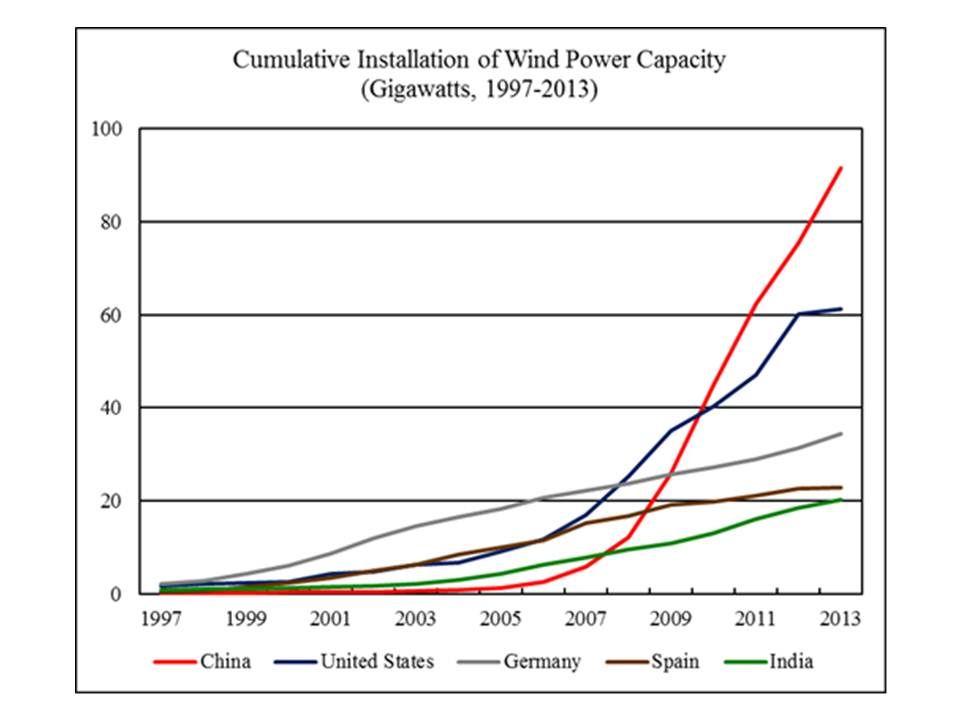 Wind electricity has grown rapidly. But eventually, the annual installation of wind power capacity will be limited by the availability of grid connection, materials, skilled workers, and other factors. For example, to install 100 gigawatts of wind electricity, it would require the consumption of 10 million metric tons of steel. Beyond a certain threshold, wind electricity may undermine the reliability of electric grid because of intermittency. World total annual installation of all types of electric power capacity is about 300 gigawatts. Only a portion of the annual installation can be committed to the building of renewable power plants.
Figure 19 shows the historical relationship between the growth and the level of annual installation of wind power capacity from 1997 to 2013. As the annual installation rises, the growth to level ratio (the growth of annual installation to the level of annual installation) tends to fall. The current trend indicates the long-term “equilibrium” annual installation to be 56 gigawatts. In 2013, the world annual installation of wind power capacity was 35 gigawatts, falling from 46 gigawatts in 2012.
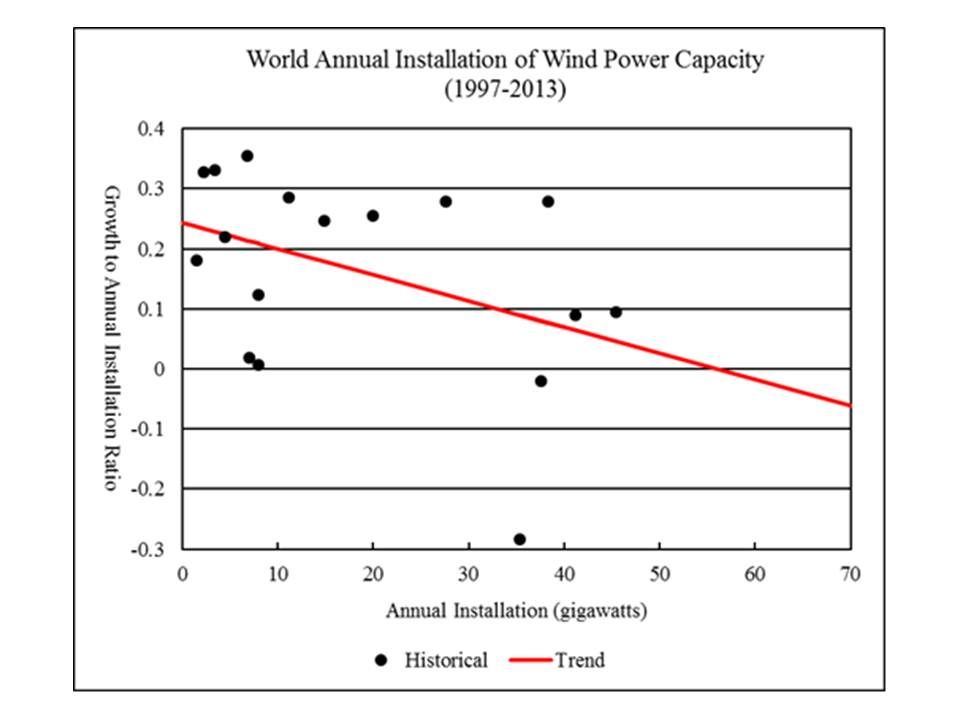 Figure 20 shows the world historical and projected annual installation of wind power capacity.
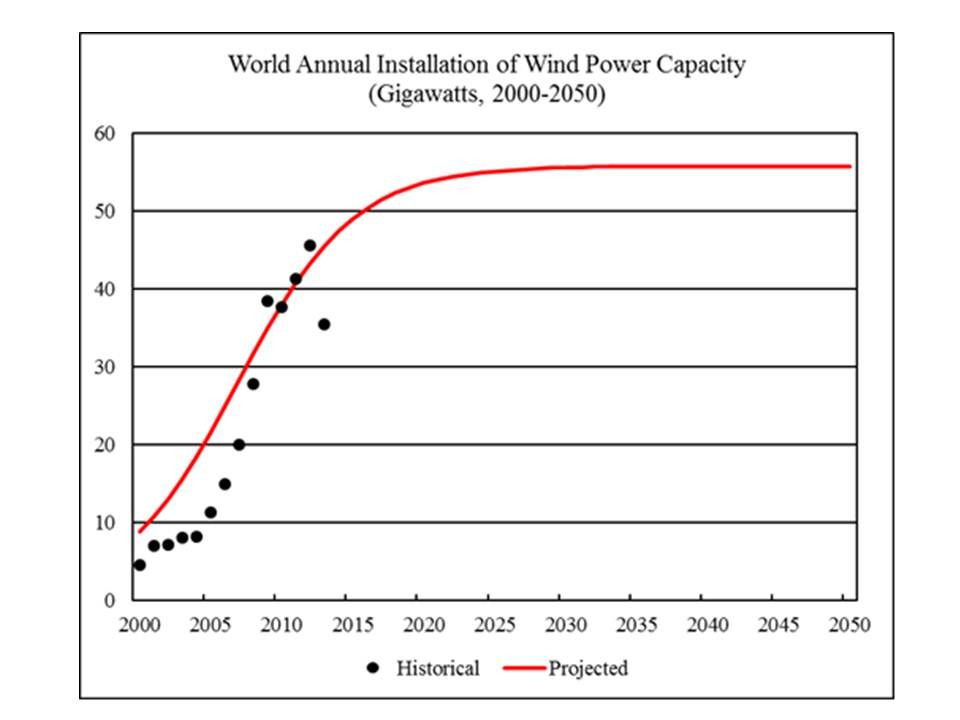
The projected annual installations of wind power capacity are used to project the growth of wind electricity consumption from 2014 to 2050 using the following formula:
Annual Growth of Wind Electricity Consumption (Mtoe) = Annual Installation of Wind Power Capacity (GW) * 8.76 * 0.25 / 4.4194
In the above formula, wind power capacity utilization rate is assumed to be 25 percent (the observed world average wind power capacity utilization rate was 22 percent in 2013). The number 8.76 = 8760 / 1000 calculates the electricity to be generated by 1 gigawatt of generating capacity operating year round and converts gigawatt-hours into terawatt hours. The number 4.4194 converts terawatt-hours into million metric tons of oil-equivalent.
Solar Electricity
According to BP Statistical Review of World Energy 2014, world consumption of solar electricity reached 125 terawatt-hours (28 million metric tons of oil-equivalent) in 2013, 33.0 percent higher than world consumption of wind electricity in 2012. In 2013, solar electricity consumption accounted for 0.2 percent of the world primary energy consumption.
In 2013, the world cumulative installation of solar photovoltaic (PV) power capacity reached 140 gigawatts, 36.8 percent higher than the cumulative installation in 2012. Figure 21 shows the cumulative installation by the world’s five largest installers of solar PV power capacity from 1996 to 2013.
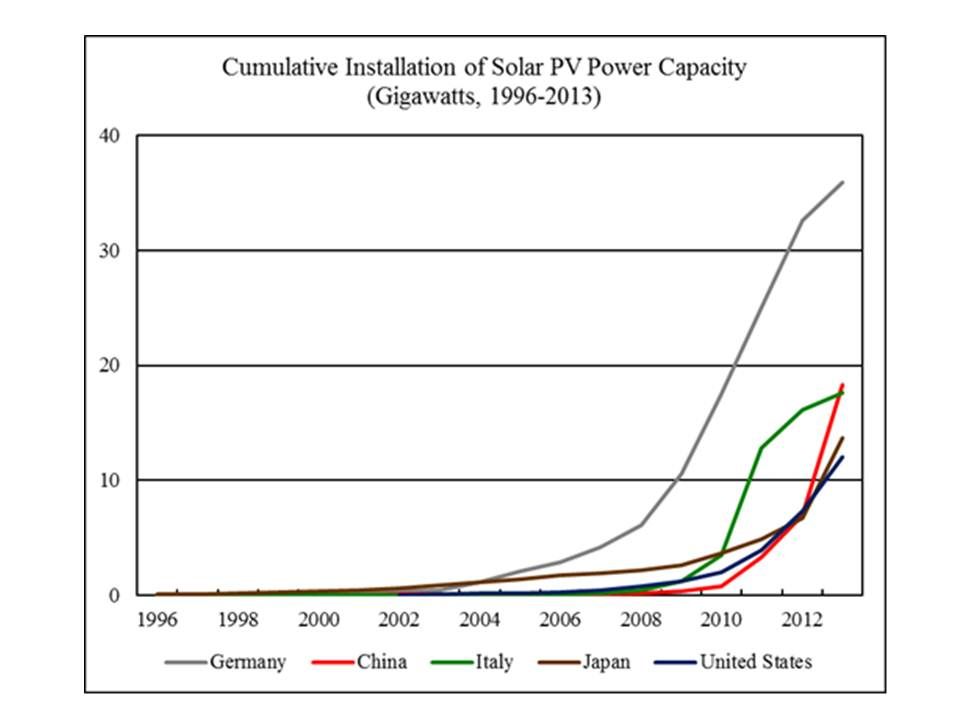 Solar electricity has grown rapidly. But eventually, the annual installation of solar power capacity will be limited by the availability of grid connection, materials, skilled workers, and other factors.
Figure 22 shows the historical relationship between the growth and the level of annual installation of solar photovoltaic power capacity from 2002 to 2013. As the annual installation rises, the growth to level ratio (the growth of annual installation to the level of annual installation) tends to fall. The current trend indicates the long-term “equilibrium” annual installation to be 108 gigawatts. In 2013, the world annual installation of solar photovoltaic power capacity was 35 gigawatts, rising from 31 gigawatts in 2012.
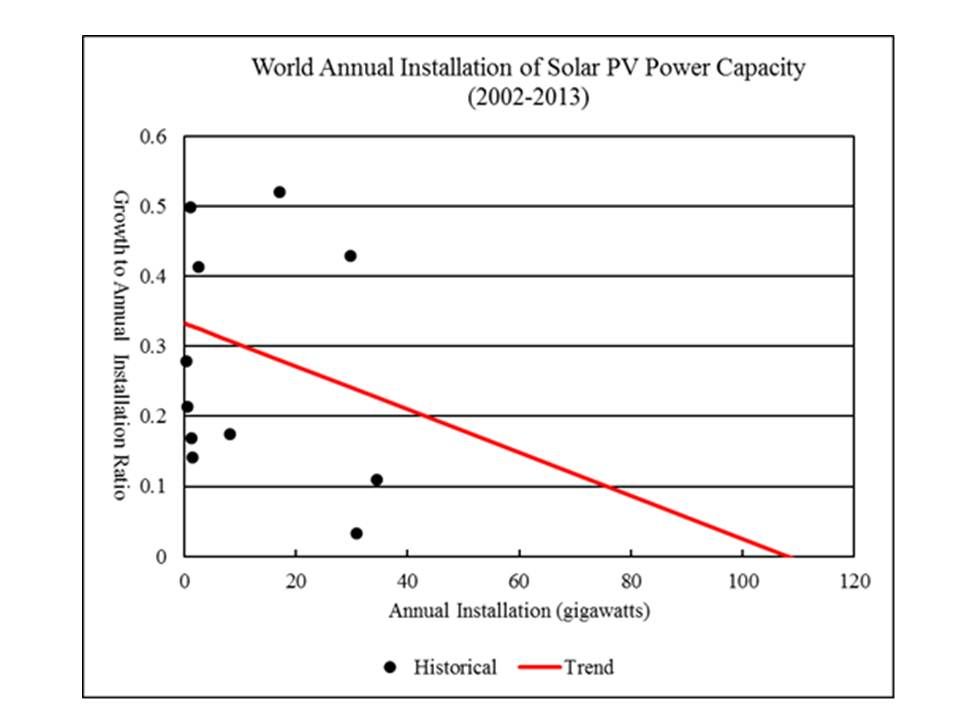 Figure 23 shows the world historical and projected annual installation of solar photovoltaic power capacity.
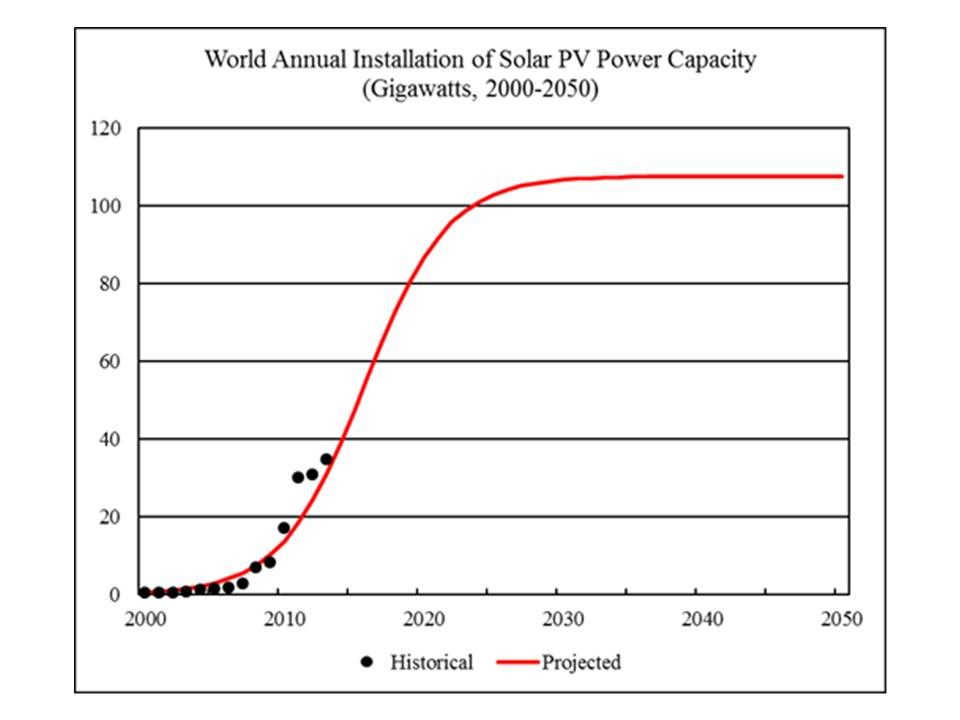 The projected annual installations of solar photovoltaic power capacity are used to project the growth of solar electricity consumption from 2014 to 2050 using the following formula:
Annual Growth of Solar Electricity Consumption (Mtoe) = Annual Installation of Solar PV Power Capacity (GW) * 8.76 * 0.15 / 4.4194
In the above formula, solar photovoltaic power capacity utilization rate is assumed to be 15 percent (the observed world average solar photovoltaic power capacity utilization rate was 10 percent in 2013). The number 8.76 = 8760 / 1000 calculates the electricity to be generated by 1 gigawatt of generating capacity operating year round and converts gigawatt-hours into terawatt hours. The number 4.4194 converts terawatt-hours into million metric tons of oil-equivalent.
Geothermal, Biomass, and Other Renewables
According to BP Statistical Review of World Energy 2014, world consumption of geothermal, biomass, and other renewable electricity reached 481 terawatt-hours (109 million metric tons of oil-equivalent) in 2013, 7.7 percent higher than in 2012. In 2013, the consumption of geothermal, biomass, and other renewable electricity accounted for 0.9 percent of the world primary energy consumption.
From 2000 to 2013, the average annual growth of world consumption of geothermal, biomass, and other renewable electricity was 4.9 million metric tons of oil-equivalent. I assume that the world consumption of geothermal, biomass, and other renewable electricity will rise to 115 million metric tons of oil-equivalent in 2014 and will grow by 5 million metric tons of oil-equivalent each year from 2015 to 2050.
Biofuels
According to BP Statistical Review of World Energy 2014, world biofuels production reached 65 million metric tons of oil-equivalent (1.3 million barrels of oil-equivalent per day), 6.1 percent higher than world biofuels production in 2012. In 2013, biofuels production accounted for 1.6 percent of the world oil consumption.
From 2000 to 2013, the world biofuels production grew in average by 4.3 million metric tons of oil-equivalent a year. I assume that the world biofuels production will rise to 70 million metric tons of oil-equivalent by 2014 and will rise by 5 million metric tons of oil-equivalent each year from 2015 to 2050.
7 Comments on "World Energy 2014-2050 (Part 2)"
J-Gav on Wed, 2nd Jul 2014 10:16 am
Wow, I’m impressed! World renewable electricity consumption almost hit 1% in 2013!
Please forgive my occasionally ironic take on energy info that comes out – just part of my nature – and writing style I suppose.
The article is nevertheless interesting and I’m also rooting for renewables as far as they can take us, but that may not be as far as the Pollyannas think.
I might also mention my skepticism about the second half of the last sentence ; + 5 million metric tons/yr to 2050? Not sayin’ it’s impossible but frankly, what the hell do we know about 2050?
Steve on Wed, 2nd Jul 2014 10:34 am
Living in the states I am amazed at the duality I am living in…so many people gobbling up energy! I am considered the downer for telling people that they need to conserve and live smaller even though the answer is so obvious….when I am out I look at these huge houses out in the middle of nowhere and wonder if they will be abandoned in the future…I say what are they going to do when it cost them $20,000 a year to heat that house! But maybe markets will be manipulated that for them 20,000 is the same as $200 today….I think Beery said it correctly that the market does not punish over consumption in the States! It rewards it! Well he didn’t exactly say that but I think that is what he meant…Hell I have been fighting for having climate change and finite resource depletion taught in our schools and it can’t be done…Also our local food co-op just tripled the size of their parking lot!!!..Is it me that is nuts or the rest of society….probably both…
Steve on Wed, 2nd Jul 2014 10:46 am
I went to a talk recently given by a company that installs solar panels and they were talking about the credits the power company gives them; at the end of the year the credits are zeroed out…Mr Installer suggested if you have a lot of credits by then have a big party and crank the heat and open the windows…Jevons paradox indeed!…the fair thing to mention to anyone wanting solar is to first think about efficiencies and that goes with countries as well…I don’t think that efficiency has to mean job loss…..What if every american was given a set amount of energy they were allowed to use what they didn’t use they could sell on the open market? Kinda of like they are doing in California with water right now…
baptised on Wed, 2nd Jul 2014 12:00 pm
Steve in the big picture, “waste not, want not” can be manipulated temporarily, But never done away with. Energy, economics, etc. But what do you do when you live in a country that lives by “smoke them if you gottem “? It is frustrating.
hiruit nguyse on Wed, 2nd Jul 2014 3:55 pm
Notice How charts on Nuclear and Hydro are calibrated in Consumption ( annual tera-watt Hours), while charts on Renewables are in Capacity / Reserve (giga-watts, Not giga-watt Hours annually). Just for once I would like to see a chart on photovoltaic solar calibrated in Tera-Watt HOURS, per Annum.
HN
Makati1 on Wed, 2nd Jul 2014 8:26 pm
simple comparison: The Philippines uses 1.5% of the electric that the US uses per person. The Philippines has 98 million people vs the US 318 million. The Philippine economy is growing at about 6% per year. The US economy is shrinking at least 1% per year.
The US imports about 20% of it’s food and exports grain.
The Philippines imports about 10% but exports the same amount or more in these foods: coconuts & coconut oil, bananas, pineapples, mangos, coffee, calamansi, & peanuts.
The average Filipino uses 1/20 the resources of an American. And, I would also say from experience, that the Filipinos are much happier then Americans.
synapsid on Wed, 2nd Jul 2014 11:21 pm
Makati,
I served with Filipinos in the Navy long ago, and I’ve long had as good friends families in the Filipino community here in the Central Puget Lowland, and I would agree just from my own experience that they are a happy and warm people, with very strong family bonds. If it weren’t for the climate I’d have visited long ago.
I read the other day, to my surprise, that the economy is the second fastest-growing in eastern Asia, after China’s. A downside to that growth is energy sources–40% from oil and 20% from coal. The country imports some of both, and produces the rest. I believe two more coal-burning power stations were recently approved for construction. The population will continue to grow, so while the population and economy are small relative to, say, Indonesia’s, the Philippines are following the same trajectory as the other countries in South and Southeast Asia.
Attention is focused on what China does as regards climate change, but India plus SE Asia have a combined population of 1.8 billion people (China’s is 1.3 billion) and all those countries use coal; it’s the preferred fuel in many. And populations continue to grow throughout the region. I don’t see how it could be done but I’d like to see the Philippines break away from the pattern as regards energy and population growth. Just a dream, I’m afraid.