

The Bakken production data, as well as the All North Dakota production data just came out with their production numbers for March 2014.
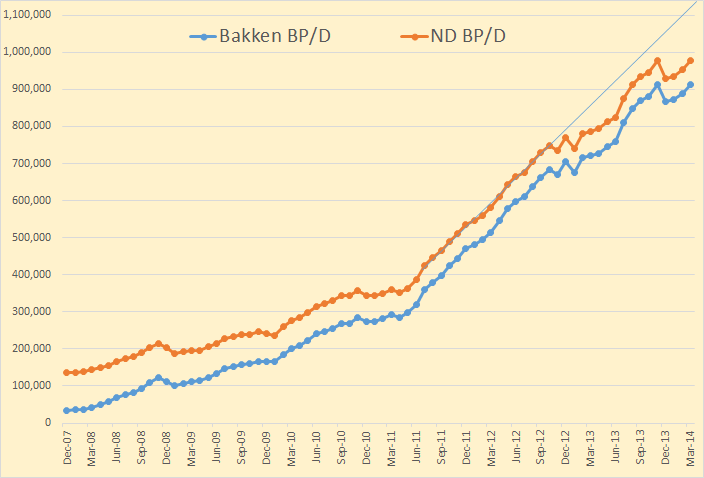
Bakken production was up 914,003 bp/d, up 25,091 bp/d from February. All North Dakota production was 977,061 bp/d, up 24,006 bp/d from February. That was a new record for the Bakken but not for all North Dakota. They are still 538 bp/d below their November 2013 numbers.
The surge in the Bakken really started in July 2011 when they doubled number of additional wells per month. Production continued to climb in pretty much a straight line through October 2012. Then bad weather and other problems started to affect production. They are now about 150,000 bp/d below where they would have been had they continued on that trajectory. (Line on chart.)
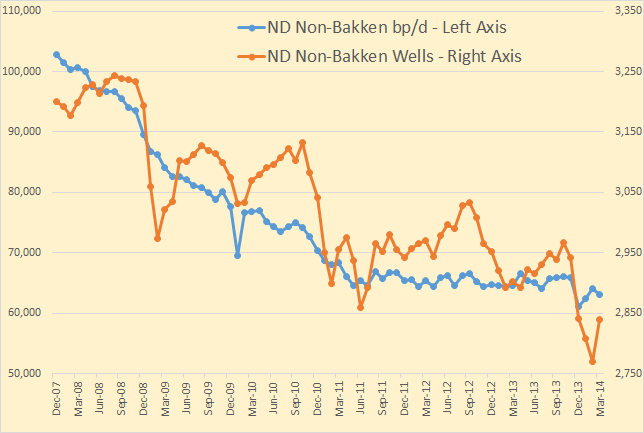
North Dakota production outside the Bakken declined at about 12% per year until the number of additional wells per month doubled on July 2011. Then it flattened out as some of those new wells were drilled outside the Bakken. But now additional wells outside the Bakken have dropped and so has production. Production outside the Bakken is still down almost three thousand bp/d from the December numbers. So though the Bakken hit a new high in March, total North Dakota production is still below the November numbers.
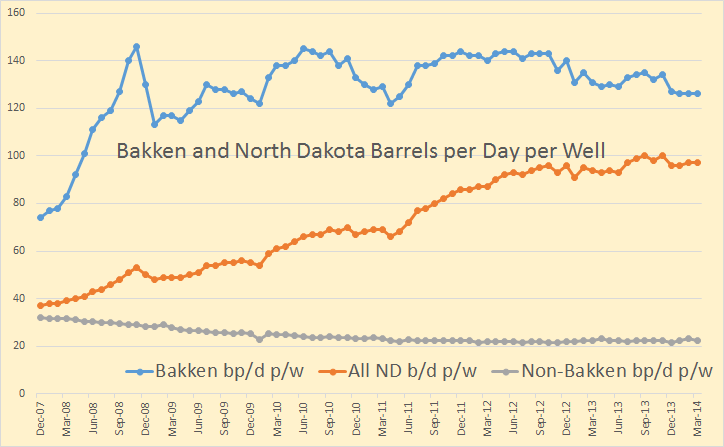
Barrels per day per well is trending down in the Bakken. And obviously wells outside the Bakken are not contributing very much.
The North Dakota production by county numbers don’t add up. If you go here:
ND Historical Barrels of Oil Produced by County and add the combined production of all North Dakota counties, (and divide by the days in the month), you get 920,802 barrels per day for February and 926,286 bp/d for March for a March gain of 5,848 bp/d. That is likely because “Confidential Wells are Not Included”. But those are all the numbers we have and those are the numbers I use on the charts below. But also note that confidential wells are included in the Bakken and state wide totals above.
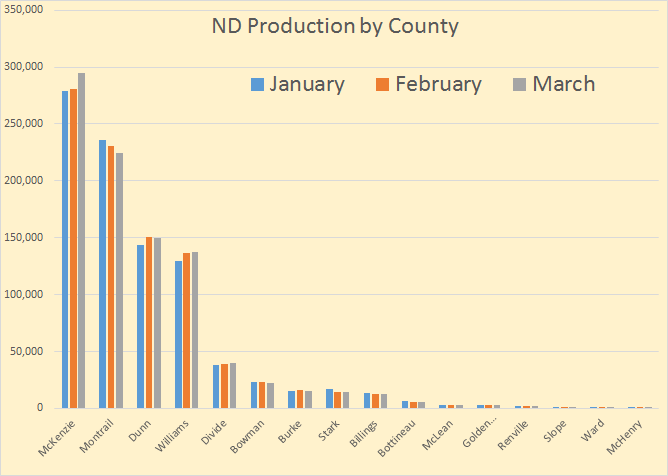
The data is sorted by production numbers. The top four counties account for 87% of all North Dakota production. (Mountrail is misspelled, sorry I will fix it next time.)
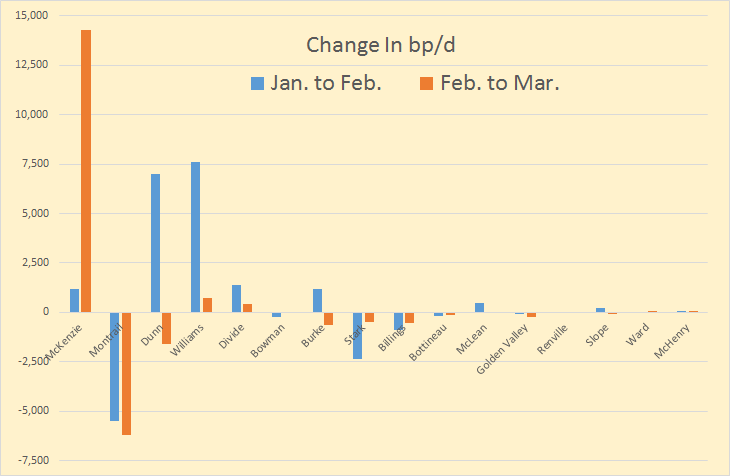
Same sort as the above chart. Though the “Confidential Wells not Included” problems distorts the chart, one can still see that almost all the action is still in only four counties. The second most productive county, Mountrail, seems to be in trouble in any case.
Comments from the Director’s Cut
The drilling rig count was up slightly from February to March and back down from March to April. The number of well completions was up sharply from 70 to 200. Investor confidence remains strong. There were still approximately 50 wells shut in for the Tioga gas plant conversion in an attempt to minimize flaring, but the biggestproduction impact was still the weather. March began with 2-3 days of temperatures well below zero, add to that 7-12 days with wind speeds too high for completion work, and then 8 inches of snow on the last day of the month. In like a lion and out like a lion
makes oil and gas work difficult.
At the end of March there were about 635 wells waiting on completion services, a decrease of 15.
Crude oil take away capacity is expected to remain adequate as long as rail deliveries to coastal refineries keep growing.
Another comment from Helms on North Dakota Oil Production.
Department of Mineral Resources Director Lynn Helms said officials had expected an even bigger bump in oil production. “The larger surge in production expected in March didn’t happen,” he said.
And an interesting stat from that same article:
The U.S. Energy Department’s Energy Information Administration says approximately 1 percent of all natural gas in the country is flared. And department data says while North Dakota accounted for only 0.5 percent of all natural gas drawn from plays in the U.S. from 2008 to 2012 it has accounted for 22 percent of the nation’s flared gas.
The Industrial Commission is expected to consider in June whether production might have to be curtailed.
Industry officials said at a day-long meeting in April that harsh restrictions could make companies consider investing elsewhere. Conservationists and oil patch residents responded that slowing down activity and allowing infrastructure to catch up with production would help alleviate flaring.
And another very interesting article: ND Production up, but not 1 million barrels yet
To further reduce flaring, companies will be required starting June 1 to submit gas capture plans with their drilling permit applications. Helms said companies recently received letters with guidelines on what those gas capture plans should look like.
“I think it’s fair to say they’re extremely nervous about what this is going to mean,” he said.
In some cases, the new requirements could delay or restrict permitting or restrict production, Helms said. The North Dakota Industrial Commission took public comment in April and is still working to develop the final piece of its plan to reduce flaring, Helms said.
I think Helms is just as nervous as the oil companies about any new restrictions on flaring in the Bakken. This could mean that wells that are barely profitable with flaring will no longer be profitable at all after these restrictions. Look for drilling outside the four main counties to slow to almost nothing.
I think we can look for a Bakken production to increase through the end of this year but by not nearly as much as a lot of the Bakken cheering section is expecting. The high decline rates are catching up. Any kind of bad weather or other problems slows drilling but the decline continues regardless of weather or other problems.
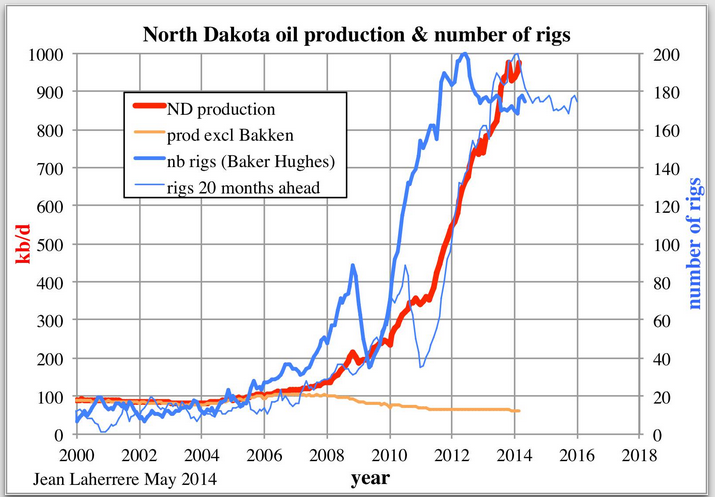
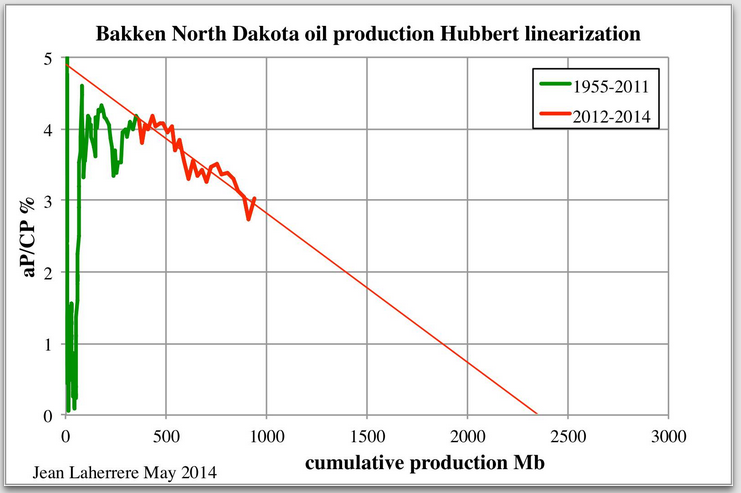
Jean Laherrere just sent me some Bakken graphs. I am posting them below along with his comments:
dsula on Thu, 15th May 2014 6:22 am
So next year we got peak? How many times did I hear that one before.
Davy, Hermann, MO on Thu, 15th May 2014 6:44 am
That will sure take the wind out of the sails of the pathological parasitic Wall Street banksters if true. Dsula, I will defer to Rock and Short for expertise in the validity of this article. I tend to think we are already in “Peak Bakken oil dynamics” considering the true cost of that “plays” effort.