Peak Oil is You

Donate Bitcoins ;-) or Paypal :-)
Page added on April 23, 2014
EIA’s International Energy Statistics Updated

The EIA has finally updated their International Energy Statistics. They were a month behind so they caught up by updating two months of data. The last update had data through October. This update has the data through December 2013. They also updated their annual data page.
If you click on the link, then mouse over “Petroleum, Production” and click, you will get “Total Oil Supply”. That data is everything including ethanol, biodiesel, NGLs and even refinery process gain. I never use that data. After that page comes I go to the box labeled “Total Oil Supply” then click on the down arrow, then click on “Crude Oil including Lease Condensate” That is the data I use, that is all I use.
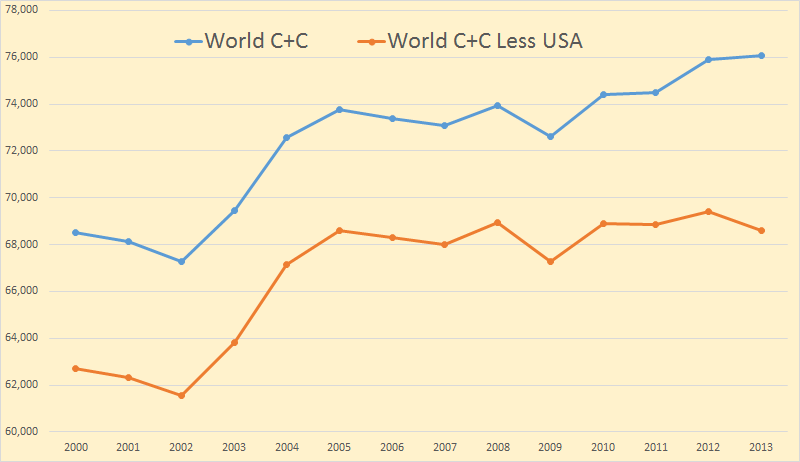
From the annual data I found total World C+C was up a mere 167 kb/d. US production was up 967 kb/d. That means that the World less USA was down 800 kb/d.
I have been following Russia pretty close on their website CDU TEK.
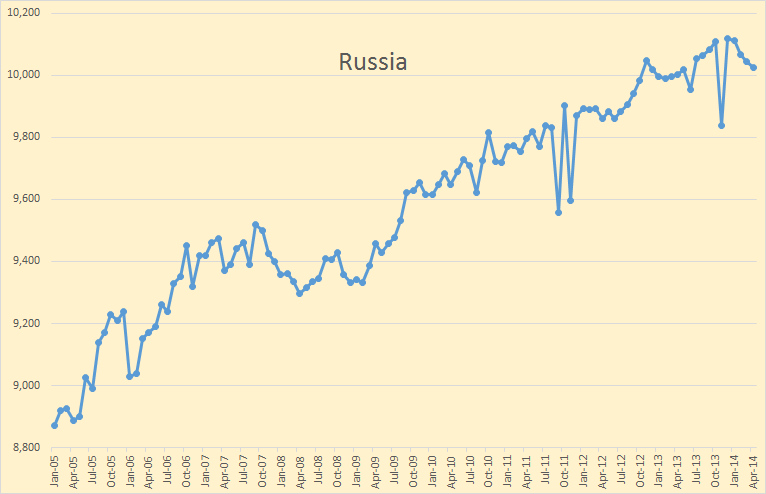
The data through December is from the EIA. The last four months, through April, I gleaned from the Russian website. Their data is daily in tons per day. I had to convert it and average it into monthly data but it is pretty close. Also, because the data on the above chart is non-zero based the increase appears greater than it really is. The increase averages out to be about one hundred thousand barrels per year.
I don’t know what the anomaly was in November. The JODI data does not show that but actually shows a peak in November 2013 above December.
Everyone has been expecting Russia to peak for several years. But their production has just kept inching up a little each year. This report is from five years ago: Alex Burgansky: Russian Oil and Gas Industry Surprises Analysts. Requires registration.
There are plenty of projects in Russia, both, new projects and existing brownfield projects. Russia is a very mature producer. If you exclude all the drilling activity taking place every year, then Russian organic decline in production is close to 19%. To compensate for that organic decline, Russia drills somewhere between 5,000 and 6,000 wells every year.
This year, as I said before, some people expected production to collapse. We certainly never thought it would collapse, but we did think it would decline. Instead it’s actually growing as a result of benefits from past investments in the new fields coming on stream this year. But we’re simply running out of the pipeline of these new fields. Therefore, next year there will be a lot fewer fields coming on stream; in the absence of new incentives to put more money to work to grow Russian oil production, it will naturally start declining, with organic decline rates of around 19% and growing.
Russia was able to keep production growing with a massive infill drilling program and new fields in Eastern Siberia, primarily Vankor. But Vankor, the largest find in Russia in 25 years at an ERR of 3.8 billion barrels, came on line in 2009 and has almost reached peak production. It is expected to produce 428,000 bpd this year and top out at 462,000 bpd in 2016.
Russia showed declines in each of the first four months of this year. Has the decline of Russian oil production finally arrived?
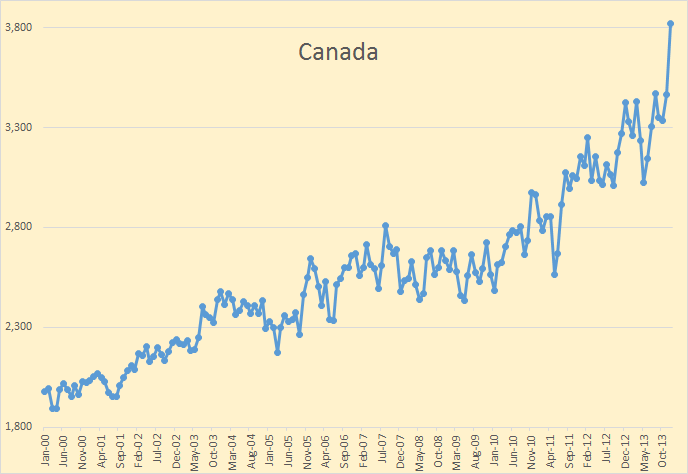
The biggest gainer in the last two months was Canada, up 487 kb/d since October.
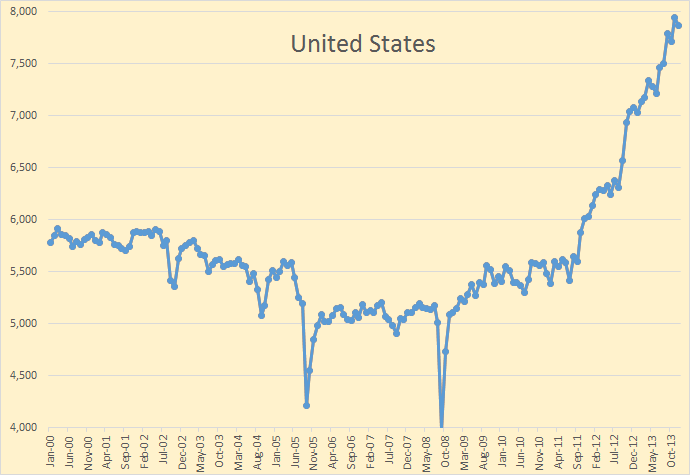
The USA was up 154 kb/d in the last two months and had a decline of 77 kb/d in December.
The North Sea, primarily Norway and the United Kingdom, showed a surprising increase in November and December. Norway expects their decline to slow this year. We shall see.
Don’t miss this one: Total SA: Peak Oil Is Catching up to Big Oil
Sometimes, falling free cash flow is a short-term issue. Such was the case after the 2008 oil crash. Oil prices fell, and as a result free cash flow fell as well.
The current downturn is different. Oil prices have remained relatively stable and yet free cash flow is falling. The reason for this change is simple. Capital expenditures (capex) are rising at a rate far above revenue, thus cutting free cash flow.
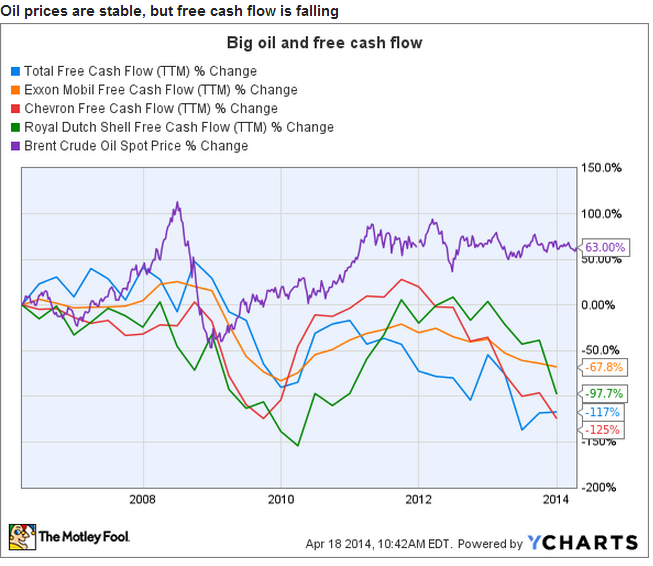
And revenue is falling because production is falling.
I have also updated the Non-OPEC Charts page with the data through December 2013.
And I also updated the World Crude Oil Production by Geographical Area page.
5 Comments on "EIA’s International Energy Statistics Updated"
Boat on Thu, 24th Apr 2014 7:20 am
Eventually even a country as backwards as Russia will benefit from a turn key approach when developing shale plays. As soon as the US figures it out first.
Davy, Hermann, MO on Thu, 24th Apr 2014 7:54 am
Article said – Therefore, next year there will be a lot fewer fields coming on stream; in the absence of new incentives to put more money to work to grow Russian oil production, it will naturally start declining, with organic decline rates of around 19% and growing.
Anyone reading about the Russian economy? It is heading into recession in the midst of a serious political situation further requiring investment away from productive economic activity. I would not be optimistic about Russian oil production in light of these economic realities.
Article said – Oil prices have remained relatively stable and yet free cash flow is falling. The reason for this change is simple. Capital expenditures (capex) are rising at a rate far above revenue, thus cutting free cash flow.
Industries that operate in a market based system have an operational environment they must function in. It is a complex financial environment of forecasts, results, and corresponding market moves. The fossil fuel industry is no different. If any industry is subject to effects of the financial system it is the fossil fuel business with its huge capital investments that take years to show results. The financial system is being repressed with low cost of money. If the cost of money goes up it will hurt the fossil fuel industry much more than other industries due to the high capex needs and long payback periods. Interest rates are near zero so which way can interest rates move. We did at one point hear interest rates may go negative but that died on the vine. It was funny we were going to see depositors pay banks to deposit money…LOL. Anyway this whole FF production situation is moving in the wrong direction. We will see major fields depleting with pressure on new sources increasing with higher costs and lower capex supply. That is a bad combination that will be like the climate with feedbacks that magnifying problems creating new problems.
Pete Wilson on Thu, 24th Apr 2014 8:04 pm
How come EIA updated the Oil stats for 2013, but not the Coal stats for even 2012 for the whole World.
Is the EIA controlled by Big Oil.
http://www.eia.gov/cfapps/ipdbproject/IEDIndex3.cfm?tid=1&pid=7&aid=1
Mark Patrick on Thu, 24th Apr 2014 8:08 pm
So it seems the Oil production including NGL, Biofuels, RPG and so on has increased by on 0.64 % even after big increase from USA. The trillions of $ in investment is just going to get a marginal increase.
RPG Talk on Thu, 24th Apr 2014 8:13 pm
Can someone explain better about this Refinery Processing Gains.
Typically 42 gallon barrel yield 44 gallons of refined products and that extra 2 gallon is called Refinery Processing Gain (RPG).
Lets say 2 gallons of Natgas Liquids is used in the process as feedstock. So does the oil industry count both the 2 gallons of Natgas Liquids and 2 gallons of RPG in Oil Production.
Now lets say that 2 gallons of Natgas (Methane) is added as feedstock, then only the 2 gallons of RPG is included, is that correct ?.