Peak Oil is You

Donate Bitcoins ;-) or Paypal :-)
Page added on February 12, 2014
OPEC Update and EIA Short Term Energy Outlook

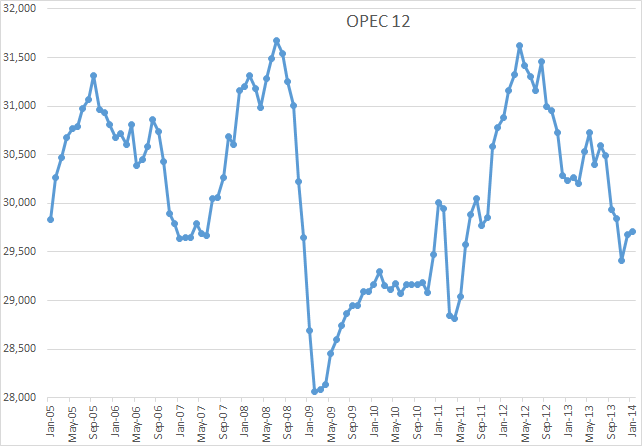
The OPEC Monthly Oil Market Report is just out with OPEC crude only production numbers for January 2014. OPEC Crude production was up 28,000 bp/d in January but that was after December production had been revised upward by 240,000 bp/d. November production was revised down by 51,000 bp/d.
Of course Saudi is always the one to watch because it is generally believed that they have spare capacity. I think they had spare capacity back in 2011 but are now producing flat out, just like every other OPEC producer.
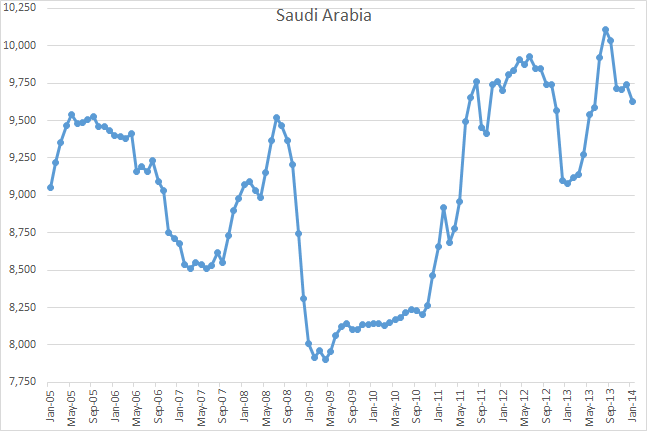
Saudi crude production was down 115,000 bp/d in January but that was after December production had been revised upward by 119,000 bp/d and November revised up 52,000 bp/d. I think that surge upward early in 2013 is a telling indication. That was Manifa coming on line.
Libya had the biggest gain in January, up 270,000 bp/d to 510,000. I guess peace may be breaking out in a few places there. Without Libya’s gain OPEC production would have been down by 242,000 bp/d.
Charts of all 12 OPEC nations can be found here: OPEC Charts.
The EIA’s Short Term Energy Report came out Tuesday the 12th. I found some of their projections interesting. The chart is in millions of barrels per day.
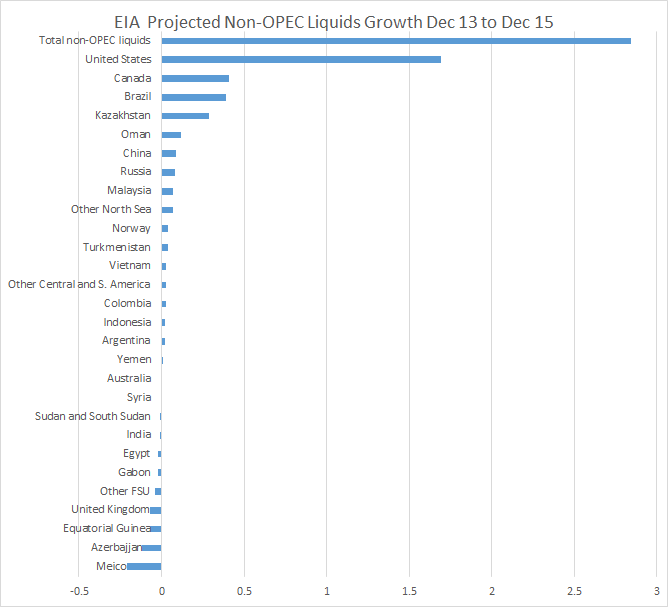
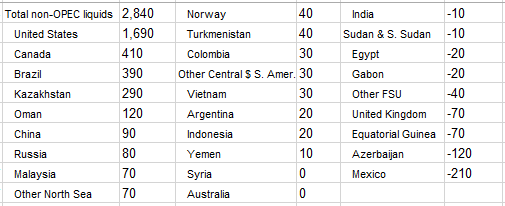
This two year Non-OPEC projection is all liquids, not C+C which I track. The EIA does not make C+C projections. Notice that 60% of all Non-OPEC increase is coming from the USA. Also the increase predicted for Brazil is very questionable, as is that of the USA of course Here is their actual predicted increase in thousands of barrels per day.
Here is a graph of their predicted growth for World Non-OPEC liquids in million bp/d.
The orange is production through January 2014. The blue is their projected liquids production through December 2015. Notice that they have January 14 liquids below the level of September 13 liquids.
I thought it might be interesting to plot All Liquids growth verses C+C growth since January 2010. The chart below has January 2010 as zero. The data is kb/d. The EIA only has posted C+C data through September 2013.
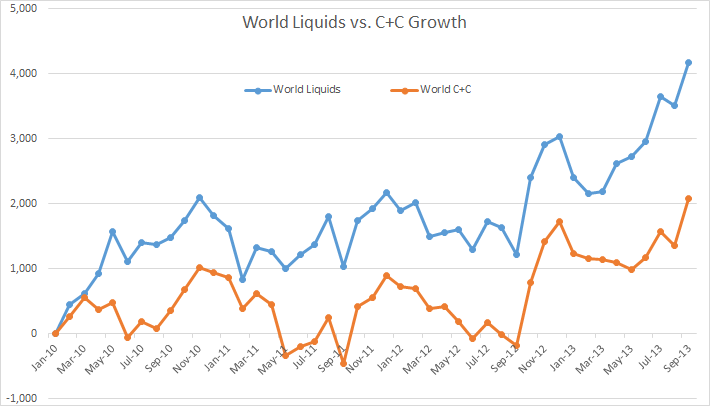
All Liquids, Jan. 10 through Sep. 2013 has grown almost exactly twice as fast as C+C, 4,170,000 bp/d vs. 2,086,000 bp/d.
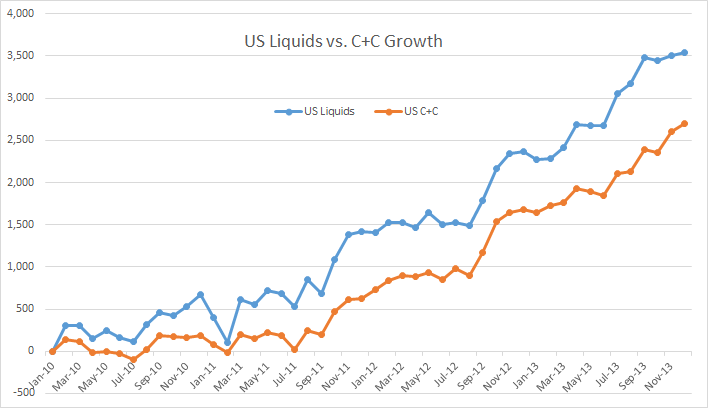
The difference between USA Liquids and C+C is not quite as dramatic, 3,540,000 bp/ vs. 2,699,000 bp/d growth since January 2010 through September 2013. The EIA has published C+C data only through September 2013. But notice also that C+C has grown more in the US alone than total World. Without the USA’s contribution then World C+C would be down 306 kb/d January 2010 through September 2013 and likely a lot more if we had C+C data through December.
One Comment on "OPEC Update and EIA Short Term Energy Outlook"
Davy, Hermann, MO on Thu, 13th Feb 2014 3:57 pm
Yeap, these graphs look good. Man lets break the Champaign out and have a toast. “OR” like the Russians, have a fine vodka then throw the glasses into the fire place! The vodka flaming up as it hits the hot embers the glass shattering with musical notes of joy and happiness, singing old Russian folk songs late into the night!
It’s the economy stupid! I want to tell these folks!