Peak Oil is You

Donate Bitcoins ;-) or Paypal :-)
Page added on January 7, 2014
GOM Production and Other News

Not much happening on the Peak Oil front these days. I checked out the BSEE Gulf of Mexico production. Data is in kb/d with the last data point September 2013.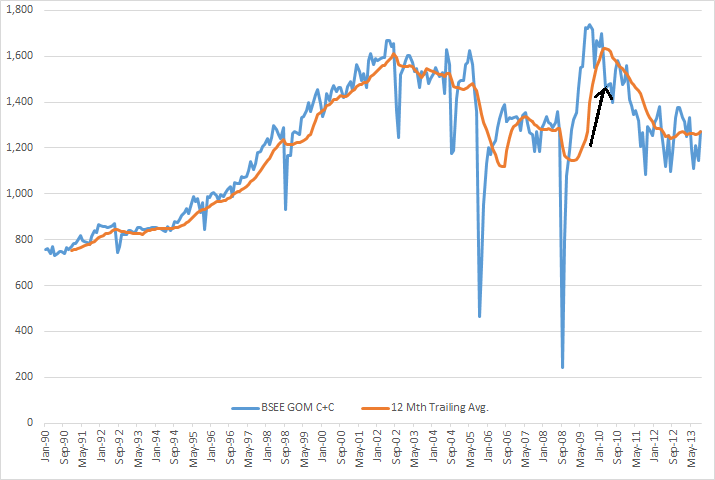
Average production from the GOM has been relatively flat for the last two and one half years at about 1.260 million barrels per day. The arrow marks April 2010, the month of the Deepwater Horizon disaster.
The big deepwater plays continue to decline. I guess they are bringing on other wells in order to keep production flat.
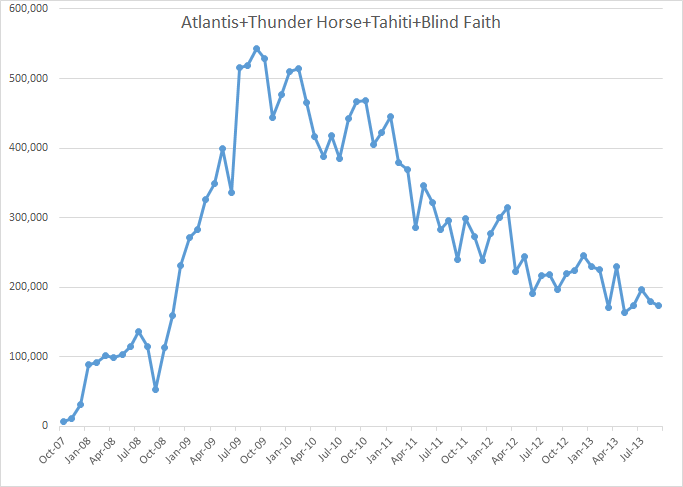
The above chart is combined liquids production of Atlantis, Thunder Horse, Tahiti and Blind Faith. The last data point is September 2013.
I found this chart while browsing the net yesterday. It was published in the Albany Tribune but they say it is from the EIA’s Short-Term Energy Outlook. I failed to locate it there however.
It’s a little fuzzy because I had to enlarge it. But it clearly shows that without the US and Canada world oil production would be in decline. Even with Canada but without the US then world oil production would still be in decline. And notice the words under the chart. “Note: Almost all countries excluding Saudi Arabia are at full capacity…”
All countries excluding Saudi Arabia are at full capacity. Saudi might produce half a million barrels per day more, perhaps less.
This chart I did find in the December Short-Term Energy Outlook, link above. It is a bit clearer. This chart clearly shows that in 2013 the world would have been in steep decline were it not from increasing production in North America.
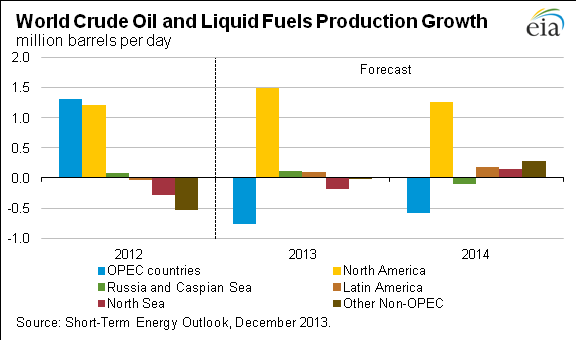
Notice that they were expecting Russia and the Caspian, (Azerbaijan and Kazakhstan), to increase slightly in 2013, they did, but are expecting them to slightly decline in 2014. That will be interesting to watch.
Something else I came across yesterday that I would like to share with you. It is also from the EIA: Shale oil and shale gas resources are globally abundant
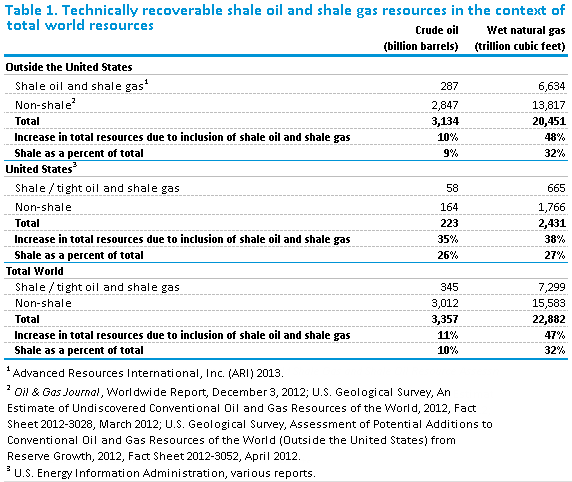
3.357 trillion barrels of “technically” recoverable oil with shale oil 10% of that total! All that oil and everyone, with the possible exception of Saudi Arabia, is producing flat out. That is over 100 years worth at current consumption rates. Is that a joke or what?
Note: The EIA still has not published their International Energy Statistics, the report of every nation’s oil production. They are almost two months behind. The last report that came out in November had production numbers only through July 2013. When, or perhaps I should say if, the report does come out I will have a post on it and also update the Non-OPEC Charts page. The OPEC MOMR is due out the 16th with OPEC production numbers through December.
One Comment on "GOM Production and Other News"
kiwichick on Tue, 7th Jan 2014 10:58 pm
why are they expecting a increase from the north sea?