Peak Oil is You

Donate Bitcoins ;-) or Paypal :-)
Page added on January 30, 2013
Oil Watch: Drill Baby Drill

Executive summary
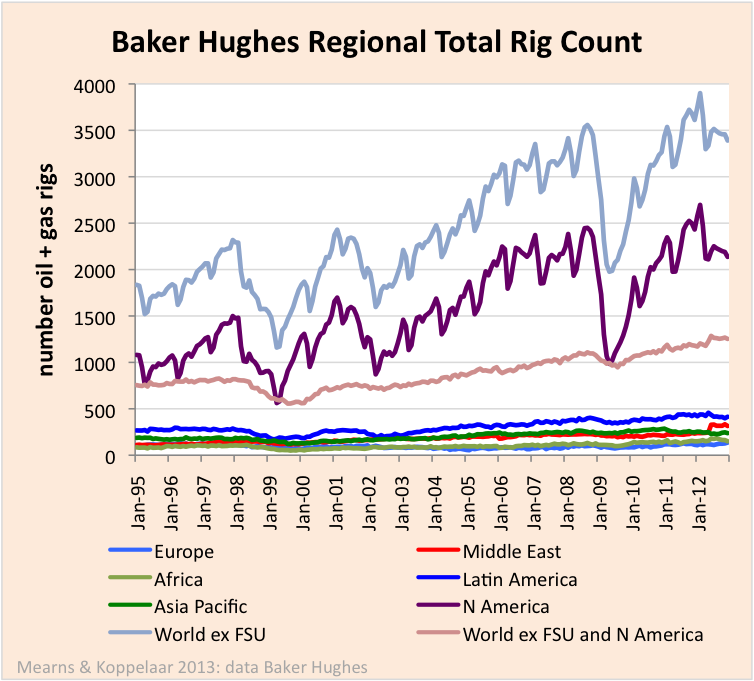
In January 1995 there was a total of 1738 oil and gas rigs drilling globally (excluding the former Soviet Union (FSU)). By February 2012 that number had more than doubled to 3850. Global C+C+NGL production grew from 68 to 84 million bpd (24%) over the same period.
Global drilling for oil and gas is dominated by North America, in particular the USA. In January 1995 there was 737 oil and gas rigs drilling in the USA, 42% of the world total. By October 2011 this figure had grown to 2010 rigs, 55% of the world total. Proportionally the USA has increased it’s drilling effort compared to the rest of the world and currently benefits from lower oil prices, significantly lower natural gas prices and higher economic growth than many OECD peers.
Does the rest of the world need to wake up and to drill baby drill?

Oil Watch posts are joint with Rembrandt Koppelaar.
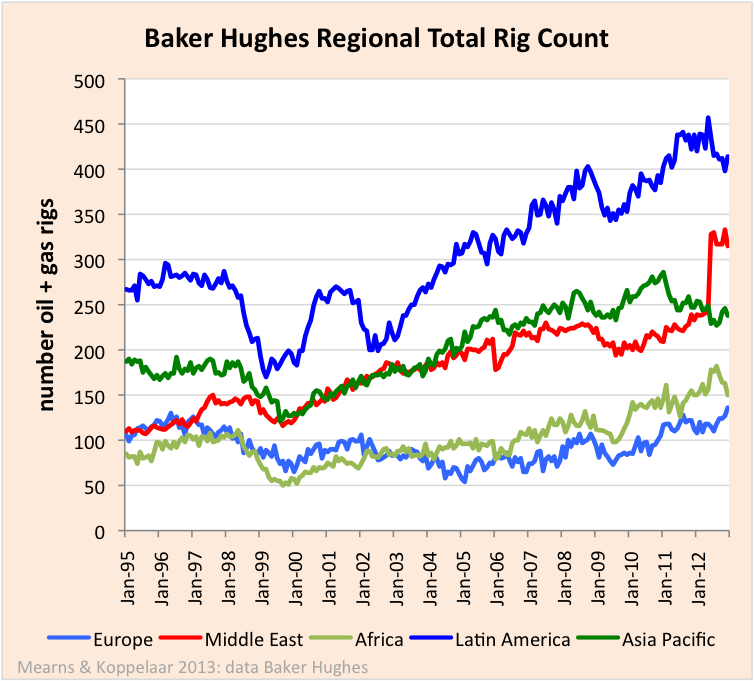
The Middle East shows a major increase in rigs of 186% from 110 rigs in Jan 1995 to 315 rigs in Dec 2012. The amazing thing about The Middle East is that they were able to sustain 20 million bpd production in 1995 with only a handful of rigs drilling wells. In 2005 the production world changed as depletion of reserves in aging supergiants meant that a higher level of drilling was required to maintain production (see Figure 7 for Saudi Arabia). The step down in the data in June 2005 is due to cessation of reports from Iran and the step up in June 2012 is due to the beginning of reports from Iraq. Note that Egypt and Sudan are included with the Middle East by Baker Hughes and these countries have been deducted from the Middle East statistics and included with Africa in this report.
The rig count for the Asia Pacific shows a marginal increase of 27% from 187 rigs in Jan 1995 to 238 rigs in Dec 2012 (Figure 3). The peak number was 286 in Jan 2011 and the decline since then most likely reflects redeployment of rigs to other regions that are presumably viewed more favorably.
The rig count for Africa has grown by 76% from 85 rigs in Jan 1995 to 150 in Dec 2012. Whilst this is a steady increase it is still a very low level of drilling activity for such a vast and locally oil and gas rich continent.
The rig count for Europe is essentially flat over the period though shows signs of rising towards the end of 2012. This is due in part to a rise in land rigs drilling in Turkey but the North Sea also shows a small uptick.


Oil drilling has recently turned down in the USA (Figure 6). If shale oil production was to continue rising into the future we would expect to see the rig number continuing to go up. It remains to be seen if the recent down turn in US oil drilling is temporary and what reasons lie behind this reversal.

Data Limitations
Baker Hughes provide a service to the global community by publishing their extensive rig count database. However, like many complex sets of statistics the data has a number of limitations as follows:
1. The main limitation of the Baker Hughes rig count is the omission of data from the FSU.
2. The count misses the drilling activity of large fixed offshore platforms some of which are continuously engaged in drilling oil and gas production and exploration wells.
3. The “International” data is reported monthly from January 1995 which is the datum used in this report. North American data is reported weekly and has been transformed to monthly averages using an XL macro. The US weekly data begins in July 1987 while the Canadian weekly data does not begin until March 1998. There is monthly data for Canada going back to 1964 but this is for total rigs, not broken out by oil and gas.From Baker Hughes Baker Hughes has issued the rotary rig counts as a service to the petroleum industry since 1944, when Hughes Tool Company began weekly counts of U.S. and Canadian drilling activity. Hughes initiated the monthly international rig count in 1975. The North American rig count is released weekly at noon central time on the last day of the work week. The international rig count is released on the fifth working day of each month.
The Baker Hughes Rig Counts are an important business barometer for the drilling industry and its suppliers. When drilling rigs are active they consume products and services produced by the oil service industry. The active rig count acts as a leading indicator of demand for products used in drilling, completing, producing and processing hydrocarbons.
Baker Hughes Rig Counts are published by major newspapers and trade publications, are referred to frequently by journalists, economists, security analysts and government officials, and are included in many industry statistical reports. Because they have been compiled consistently for 60 years, Baker Hughes Rig Counts also are useful in historical analysis of the industry.
Leave a Reply