Peak Oil is You

Donate Bitcoins ;-) or Paypal :-)
Page added on November 26, 2012
Oil Watch – OPEC crude oil production (IEA)
")
Executive summary
OPEC is currently pumping at close to near term and historic highs of 31.2 mmbpd of crude oil. Outside of Saudi Arabia, the majority of spare capacity is deemed to lie in Iran and Nigeria. Iran could certainly pump more if permitted to do so by the international community. It is doubtful that Nigeria could. The UAE Kuwait, Qatar, Libya, Algeria and Venezuela are all pumping at close to capacity levels. Saudi Arabia alone has meaningful spare capacity of 2.1 mmbpd.
Embedded in the production stack (Figure 1) is an intriguing tale of general strike, international conflict, civil war and sanctions combined with masterly control of oil supply that has kept global markets in balance.
From May 2007 to August 2010, Rembrandt Koppelaar published an e-report called Oil Watch Monthly that summarised global and national oil production and consumption data from the International Energy Agency (IEA) of the OECD and Energy Information Agency (EIA) of the USA. This is the second in a series of new Oil Watch reports, co-authored with Rembrandt and details crude oil production data for 12 OPEC countries (includes Angola and Ecuador, excludes Indonesia) as reported by the International Energy Agency. Earlier editions:
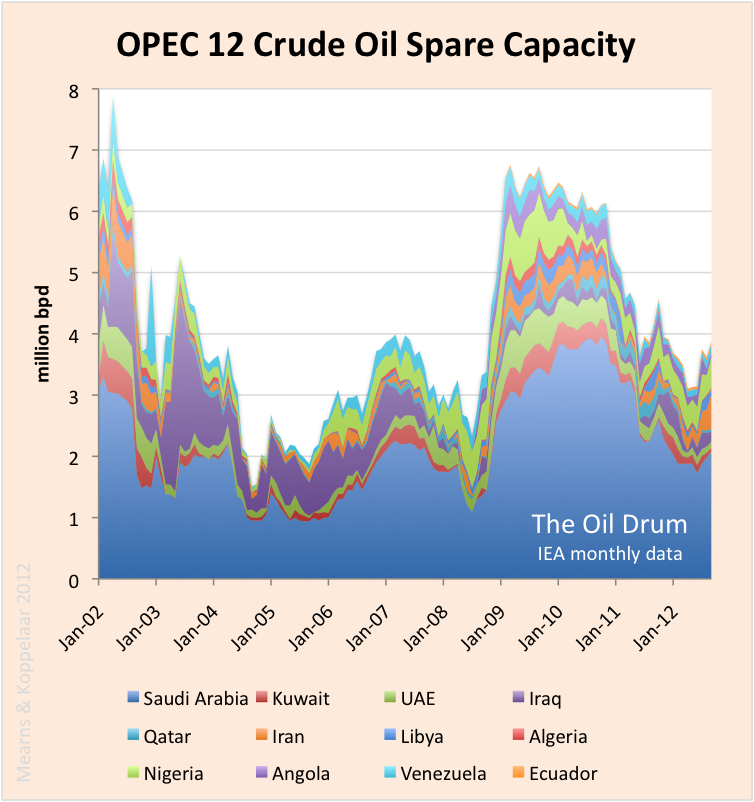
Spare Capacity
The existence and size of OPEC spare capacity is the subject of some controversy and debate. The spare capacity data reported by the IEA are shown in Figure 2, exceeding 7 mmbpd in 2002 and reaching a low point of 1.2 mmbpd in September / October 2004 that coincided with the onset of rapidly rising oil prices. One thing is clear, at times of over-supply OPEC do withhold production to support price illustrated by the >>5 mmbpd rise in production between January 2002 and October 2004 (Figure 1) with the corresponding decline in spare capacity (Figure 2). And again in 2008, following the financial crash, production was reined in by Saudi Arabia, the UAE, Kuwait, Qatar, Iran, Libya and Algeria to compensate for declining demand for oil (see following sections).
Adding spare capacity to the production stack shows how spare capacity compensates for the ups and downs of OPEC production that aims to keep global oil markets in balance (Figure 3). Total capacity rose from 31.8 mmbpd in January 2002 to a plateau level of 35 mmbpd in June 2009.
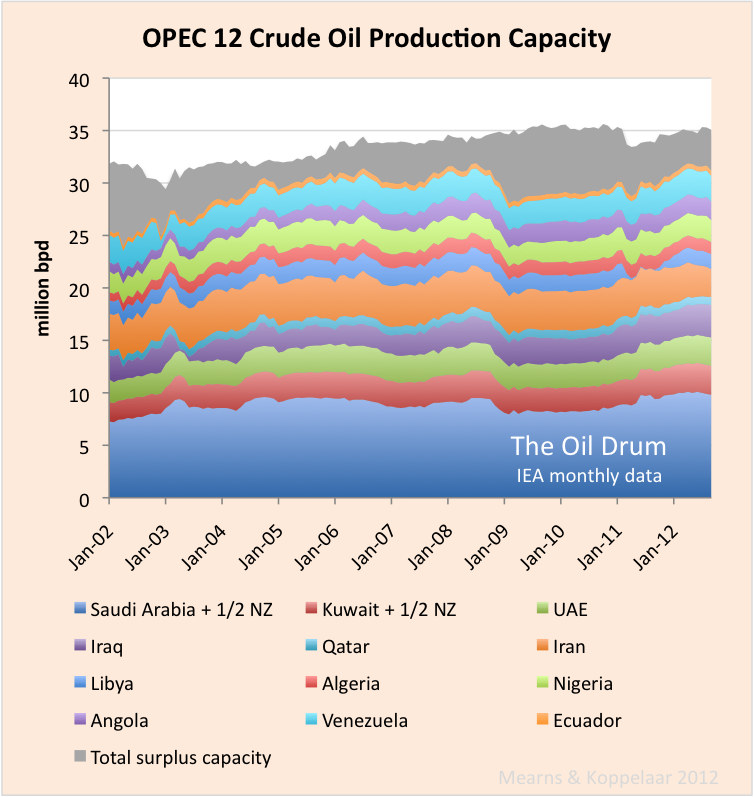
Figure 3 shows how spare capacity is pinched out over the production highs and the question remains as to whether OPEC actually has real spare capacity at those times. Outside of Saudi Arabia the majority of spare capacity currently resides in Iran and Nigeria. The former is subject to sanctions and the latter to ongoing civil / tribal unrest and it does not seem likely that either country could or would be allowed to boost production to meet ongoing strong demand.
The total capacity chart (Figure 3) shows a remarkably smooth development considering the turmoil in many OPEC countries. The small dip in 2002 shows the impact of a national strike in Venezuela and the small dip in 2011 reflects the civil war in Libya. Loss of Iraqi production during the 2003 war was largely compensated by a rise in Saudi, UAE and Kuwaiti production.
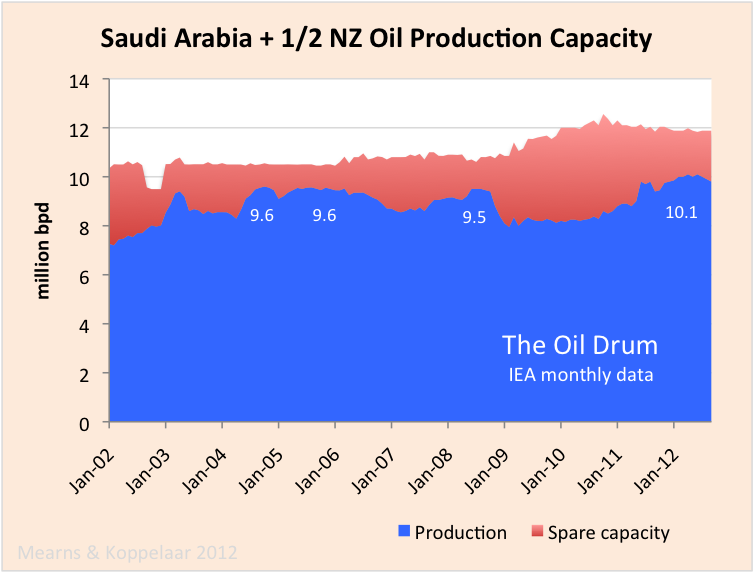
Saudi Arabia
Saudi production data includes 50% of the Neutral Zone between Saudi Arabia and Kuwait which currently produces 600,000 bpd of mainly heavy oil. Total Saudi capacity remained remarkably constant from 2002 to 2008 at around 10.5 mmbpd. In 2009 / 10 capacity rose to a peak of 12.3 mmbpd in August 2010 as a result of new fields being developed and has since been in slow decline. Most recent announcements by Saudi Arabia on future developments is to maintain capacity at 12 mmbpd where new developments will simply compensate for declines in aging supergiants.
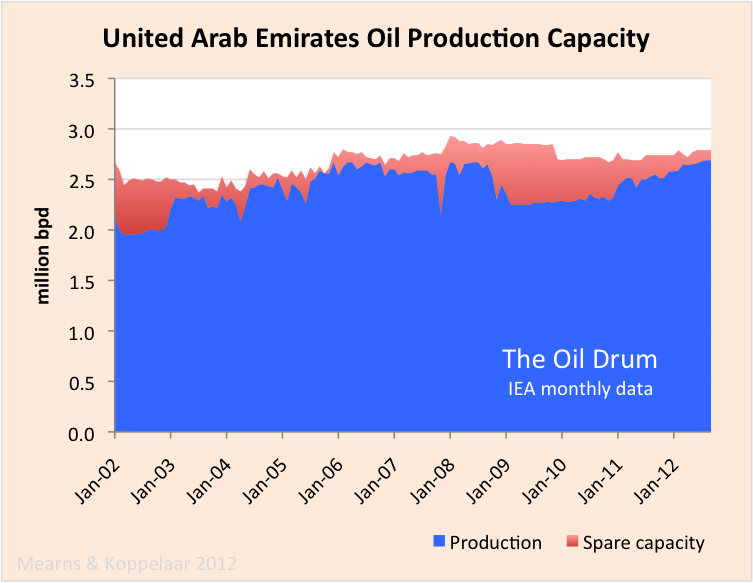
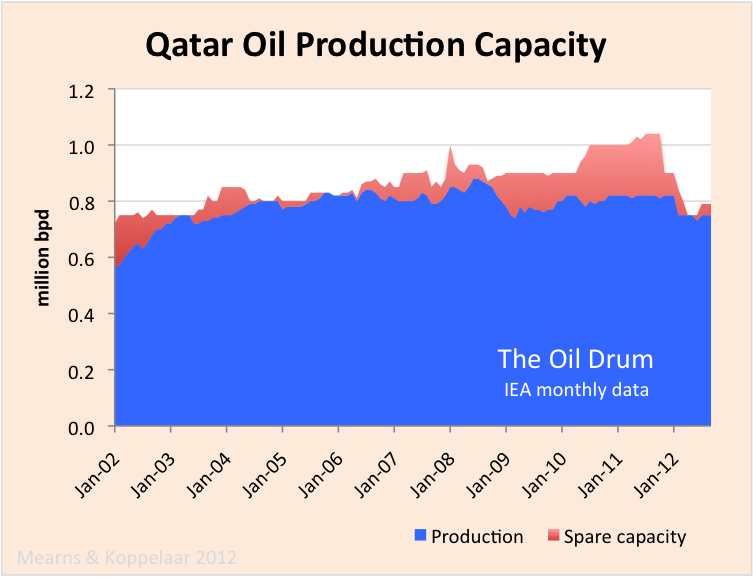
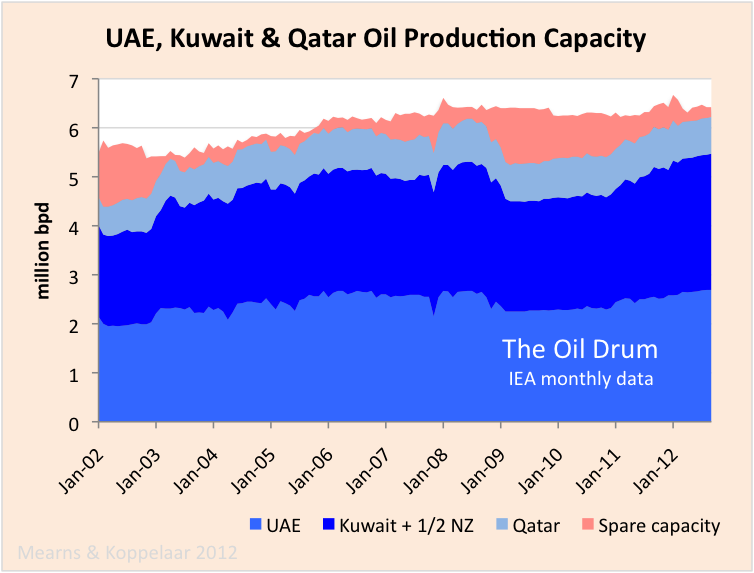
UAE, Kuwait and Qatar
The United Arab Emirates, Kuwait and Qatar all show a similar development in crude oil production and spare capacity since January 2002. Each country has shown only small growth in total capacity over the period. From 2002 to 2005 production grew in each country at the expense of spare capacity and from 2005 to 2008 spare capacity was small and likely non-existent. Each country reduced production following the 2008 financial crash but since then production has once again grown and spare capacity has been squeezed. Since 2008, Qatar is somewhat different since production has declined and the IEA now interpret Qatari spare capacity to be close to zero. This will be something to watch in the coming months and years.

Iraq
According to BP, the historic high for Iraqi C+C+NGL production was 3.49 mmbpd in 1979 prior to the Iran-Iraq war. Pre-2003 war and invasion Iraqi total capacity was interpreted to have dropped to 2.8 mmbpd and during the subsequent years of occupation capacity settled on a lower figure of 2.5 mbpd. Decades of conflict have scarred the Iraqi oil industry.
A post war oil production low of 1.5 mmbpd was recorded in January 2006 but since then production has grown steadily to a recent high of 3.12 mmbpd recorded in September 2012. This growth at first came from reinstating production from spare capacity but since January 2008 it has come from building new capacity. It is difficult to predict where Iraqi oil production is headed but the IEA forecast 6.1 mmbpd by 2020.

Iran

Iranian crude oil production capacity remained constant at around 4 mmbpd from January 2002 to around September 2010, producing close to capacity for much of this period. Since September 2010 the impact of sanctions have begun to bite and as of September 2012 production stood at 3.2 mmbpd and falling fast. It is worth noting that declining Iranian production is matched by rising Iraqi production. Should Iranian production continue to fall and Iraqi production continue to rise, at some point the global oil supply system should be able to absorb the loss of Iranian production all together.
Libya
From January 2002 to 2008 Libyan oil production was rising owing to the participation of OECD companies in that country. Production was cut following the financial crash of 2008 but then in March 2011 Libya went off line during the civil war with over 1.5 mmbpd lost. Libya was offline for about 11 months and production has not yet recovered to pre-conflict levels. It seems possible that without the participation of foreign companies and capital that Libyan production may enter a prolonged period of decline.

Algeria
Algeria has also permitted the participation of foreign companies in exploration and field developments and it has an overall production history similar to its N African near neighbor Libya, apart from the absence of a civil war. Algerian production rose at the beginning of the period, produced at capacity from 2005 to 2008, cut production following the financial crash but has not managed to regain the pre-crash highs. Production took a 150,000 bpd step down in early 2012 and spare capacity is currently deemed to be close to zero. It seems that Algeria may be struggling to maintain the pre-2008 production levels.

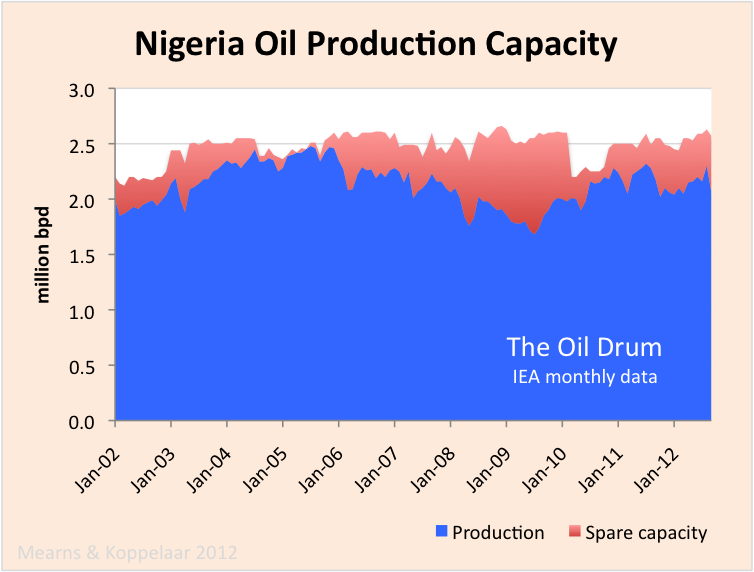
Nigeria
The Nigerian oil industry is to large extent operated by the International Oil Companies within a framework prescribed by the Nigerian government, OPEC and tribal anarchy. Production has been largely flat over the decade, either side of 2 mmbpd. In September 2012 spare capacity was logged at 510,000 bpd and it seems unlikely that Nigeria could call on that capacity at short notice.
Angola
Angola joined OPEC in 2007. Most of Angola’s oil production is off shore and is operated by the International Oil Companies. As new offshore fields came on stream, Angola’s production rose from 920.000 bpd in January 2002 to 1.9 mmbpd in July 2008. Since then, production has fluctuated moving sideways and down. The IEA has progressively cut their view of spare capacity and it seems doubtful that Angola actually has withheld production at the present time.

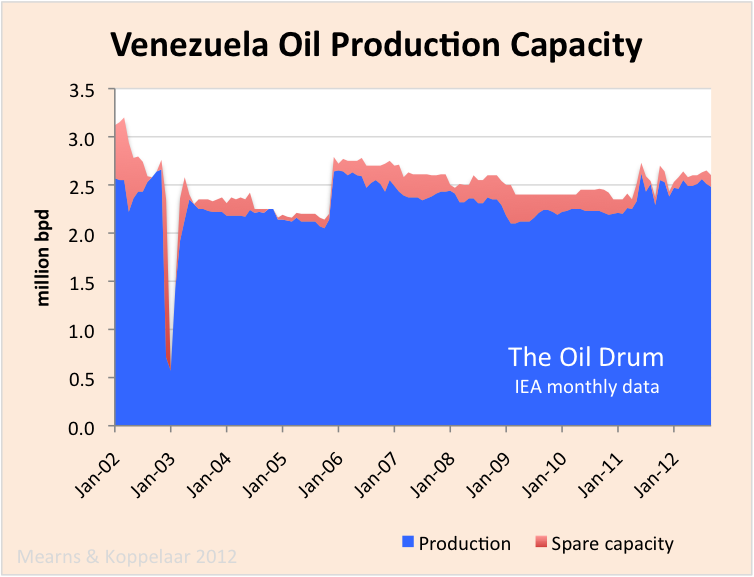
Venezuela
OPEC stalwart and heavy weight Venezuela has had flat production over the decade of between 2 and 2.5 mmbpd. The impact of the 2002/ 03 general strike upon production is clear to see. Production has been hitting near term highs over 2.5 mmbpd and spare capacity is essentially zero.
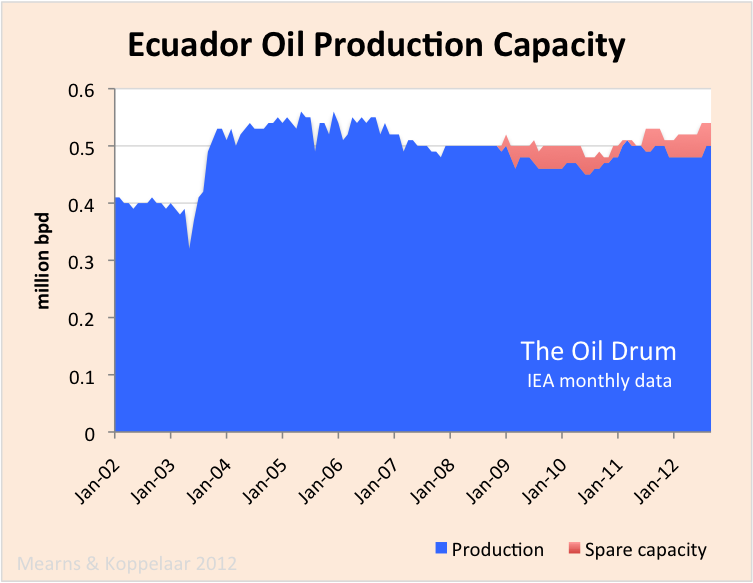
Ecuador
Ecuador rejoined OPEC in 2007 and with production of only 500,000 bpd is the baby of the bunch. Production appears to be on plateau / slow decline.
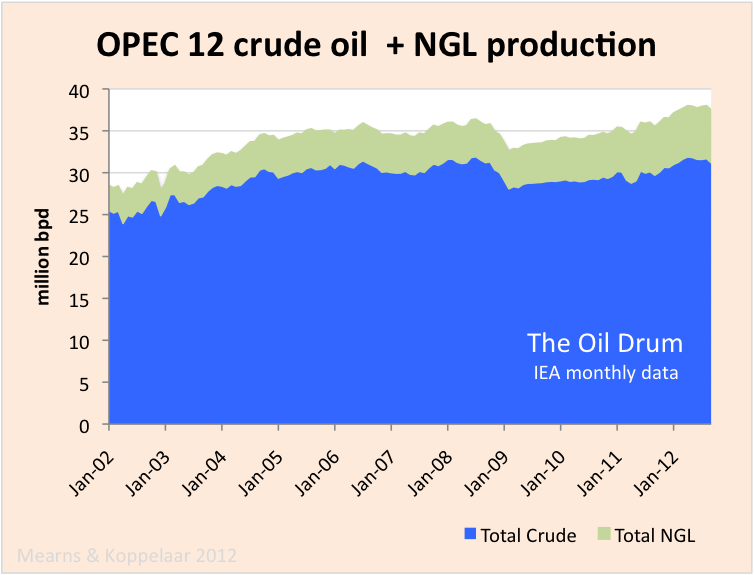
Natural Gas Liquids
Finally, to complete the OPEC picture, we need to look at natural gas liquids (NGL). The IEA report country specific crude oil data for OPEC members but only aggregate NGL data for the OPEC group. I am unsure whether OPEC condensate is monitored by the IEA.
OPEC NGL production has grown from 3.0 mmbpd in February 2002 to 6.3 mmbpd in September 2012. A significant component of that growth likely comes from North Field gas production in Qatar.
12 Comments on "Oil Watch – OPEC crude oil production (IEA)"
Others on Mon, 26th Nov 2012 6:55 pm
Lot of cookup in numbers is going on.
NGL has shown significant increase with the increase in production of natgas, but its not shown clearly.
As per EIA, the world bio fuels production last year was 2.1 million b/d, but BP stats shows it as 1.1 million b/d. Where did the other 1 million b/d go.
All this is done to show that Oil is the / and the World’s leading source of energy and will remain so.
Newfie on Mon, 26th Nov 2012 11:01 pm
“Oil is the world’s leading source of energy and will remain so.”
Oh really ? For how long ? Forever ? I doubt it….
Others on Tue, 27th Nov 2012 12:47 am
http://www.platts.com/RSSFeedDetailedNews/RSSFeed/Oil/8942633
Saudi Arabia takes notice of rising oil consumption. They want to move the power generation from Oil to Solar and Nuclear.
Read again.
“Solar and Nuclear”
Here people are day dreaming about Oil Boom.
actioncjackson on Tue, 27th Nov 2012 1:23 am
They are all flat or declining except for Iraq which shows some recent increase.
BillT on Tue, 27th Nov 2012 1:34 am
Iran probably does has spare capacity, but the Saudis don’t. They keep lying about it but the proof is in the numbers from past years. The decline in exports are being noticed around the world and OPEC is losing control of oil prices, at least in the downward direction.
The first chart says it all. We are bouncing on a plateau and will soon start the eternal slide down the other side of the oil mountain. The one full of higher and higher prices, environmental destruction, and eventually, the end of oil as an energy source.
Arthur on Tue, 27th Nov 2012 3:05 pm
http://www.bloomberg.com/news/2012-05-10/saudi-arabia-plans-109-billion-boost-for-solar-power.html
Saudi-Arabia knows best how much oil it (does not) has/have… and is voting with it’s feet… away from oil towards solar. Lawrence of Arabia never realized how much energy gold is stored in deserts.
We calculated earlier that is enough to cover an area like Spain with solar panels in order to completely replace the planets energy needs. Everything: electricity, gas, cars, industry, everything. How big is SA? Four times Spain, largely useless desert. SA has two choices: sell their oil to the last drop or invest their oil capital into a desert filled with panels… and export electricity to the West, China, etc. It is the only use a desert has. And in contrast to Egypt or Algeria, SA has the capital to convert the potential into reality. Maybe some Saudi smarties thought of that also and decided to make a start.
Why not use google maps (satellite mode) to explore the SA desert to verify it is empty.
Arthur on Tue, 27th Nov 2012 4:05 pm
I refined my previous post in a blogpost and suggest how Saudi-Arabia could very well continue to play a significant role as planetary (solar) energy hub after the end of the oil age:
http://tinyurl.com/cj9kjzs
BillT on Wed, 28th Nov 2012 1:32 am
Arthur, S.A. is a desert, full of Arabs, most of whom are only interested in their next meal and their daily prayers. Yes, you could cover S.A. with solar panels and then what? Who has the trillions to build a method to distribute that electric? S.A.? Nope! They too have dreams that will likely end when the Saud family is killed off during the coming riots and revolts.
The current shipping lanes are going to get very uncrowded in the near future as intercontinental shipping slows to dribble. S.A. has nothing but sand and oil/NG. When the oil/NG is gone, they will have only sand. No other resources. Ditto most Middle East countries. In 50 years, they will be back to the 18th century.
SOS on Wed, 28th Nov 2012 4:39 am
Those charts are rediculous. For one thing OPEC has been pumping at historic highs each and every year they have pumped. Thats why the graphs go up.
The Saudis are smart in some cases to retire very expense oil generated power plants. You see they can afford to install expensive solar panels and sell the oil they used to burn while junking those expensive to maintain generators. Its not a sign of a changing world, just another way big oil makes money.
Arthur on Wed, 28th Nov 2012 11:51 am
“Arthur, S.A. is a desert, full of Arabs, most of whom are only interested in their next meal and their daily prayers. Yes, you could cover S.A. with solar panels and then what? Who has the trillions to build a method to distribute that electric? S.A.? Nope! They too have dreams that will likely end when the Saud family is killed off during the coming riots and revolts.”
Most Arabs are only interested in their next meal now, but SA is nevertheless the 2nd largest oil producer of the planet… because westerners extract the oil for them and even pay for it. It will not be different in the future. One of the positive outcomes of the coming war in the Gulf (if it can be contained, a big if) will be the destruction of the oil infrastructure and the subsequent killing of the economy in the West, including the European car industries. Maybe that would be a beneficial 2nd oil shock that could lead us to change thinking and decide to use the remainder of the oil in the ground of Arabia to setup a new energy base… again by westerners. For Arabs this could lead to a nice employment opportunity of dusting off these panels rather than be a camel breeder. 😉
It does not cost trillions to build high voltage lines:
http://en.wikipedia.org/wiki/Electric_power_transmission#Cost_of_electric_power_transmission
“The cost of high voltage electricity transmission (as opposed to the costs of electricity distribution) is comparatively low, compared to all other costs arising in a consumer’s electricity bill. In the UK transmission costs are about 0.2p/kWh compared to a delivered domestic price of around 10 p/kWh”
It does not matter if the Saudi family will follow Saddam or Czar Nicolas or Adolf or Bush/Cheney/Pearl/Zakheim/Wolfowitz/Netanyahoo/Olmert/Silverstein after a public hanging on the central square of Bagdad after 9/11 truth comes out… there will be a life in SA after that event. The Saudi desert is here to stay, so are the sun rays for the coming 2 billion years.
SOS on Wed, 28th Nov 2012 12:17 pm
Our government is working in concert with forces in the middle east intent on destroying oil. At the same time they work on destroying it at home employing all kinds of useful idiots along the way. The end result, if successful. Will not be good for the average hairless ape that is led and controlled so easily. The secret to bringing down a society is in education. Create schools like we have and the product is the reflection rabble mindlessly burning libraries
Arthur on Thu, 29th Nov 2012 11:32 am
“Our government is working in concert with forces in the middle east intent on destroying oil”
The only thing the US government destroys in the ME are governments it does not like. Not entiry sure who you mean with these ‘forces’ and how one ‘destroys oil’. It is all very mysterious and complicated at that.
“Create schools like we have and the product is the reflection rabble mindlessly burning libraries”
What on earth is a ‘reflection rabble’ and what libraries have been burned lately?