Peak Oil is You

Donate Bitcoins ;-) or Paypal :-)
Page added on May 9, 2012
Norwegian Crude Oil Reserves and Production as of 12/31/2011

In this post I present an updated view on Norwegian crude oil exploration, sanctioned developments, discoveries, production, reserves and what these now suggest for the future of Norwegian crude oil production.
The content for this post was originally published in Norwegian here and here.
Figure 01: The chart above shows a forecast for crude oil production from the 21 discoveries presently sanctioned for development on the Norwegian Continental Shelf (NCS) and which are scheduled to start flowing from 2012 to 2016.
In Figure 5 these and a forecast for Johan Sverdrup are shown as parts of a forecast of crude oil production from NCS. Click on all charts to enlarge and to open in a new window.
After oil prices moved upwards and settled at a higher level starting around 2005, a new wave of exploration resulted in sanctions for developments of several new and known discoveries that previously had been on hold due to lack of profitability.
These new developments are expected to add up to 350 kb/d of additional oil production, reaching a peak in 2016. This is by itself impressive given the location of the discoveries (offshore, water depth), their size and the total efforts required to bring these to fruition. These 21 developments have been estimated to hold total recoverable reserves of 1 Gb crude oil, 140 Gcm (Gcm = Bcm: Billion cubic meters) of natural gas, around 23 Mb condensates and around 164 Mb NGLs.
These 21 new developments are “small fields”. What characterize “small fields” are rapid buildup and a short plateau followed by aggressive (high) decline rates. Total investments for these 21 developments are now estimated to be around 225 billion NOK (2011) or US$40 billion. Most of the developments shown in Figure 1 have been estimated to be profitable for crude oil prices ranging from US$40 – US$90/bbl.
HISTORY OF NORWEGIAN CRUDE OIL DISCOVERIES

Figure 02: The chart shows the history and status of total annual discoveries (stacked columns) of crude oil from the start of oil exploration on the NCS in the mid 60’s until the end of 2011.
The light green columns show what has been sold and delivered. Dark green shows estimated total remaining recoverable reserves. The yellow columns show total discoveries that have not been sanctioned as of end 2011.
Furthermore, the chart shows annual extraction (thick black line) of crude oil since oil production started back in 1970. In the chart is also included a table identifying the year of discovery and name for all fields with more than 1 billion barrels (Gb) of recoverable crude oil.
Figure 2 shows that:
- The bulk of discoveries on NCS was made in the early years of exploration (see also Figure 3 where total discoveries are sorted by decade) and these presently heavily depleted fields still contribute a major part of total Norwegian crude oil production (see also Figures 6 and 7).
- 1979 stands out as the year with most total crude oil discoveries on NCS including amongst others: Oseberg, Troll and Snorre.
- Until 1987 more oil was annually discovered than what was extracted. Then, with the exceptions of 1991, 1992 and 2010 (Johan Sverdrup) more crude oil was extracted than was discovered. The depletion of the oil reserves is also illustrated in Figures 4 and 5.
- The number of and total amounts of discovered oil grew after oil prices moved above US$50/bbl in 2005. This suggests that oil companies have had several prospects in the drawer that became economically attractive to explore with the increase in oil prices and the income growth that allowed for drilling them.
The discovery in 2010 of Johan Sverdrup (formerly Aldous Major South/Avaldsnes), which saw its reserves number soar following an appraisal well in the fall of 2011, is very much an “outlier” relative to the size of the discoveries in the last two decades. Figure 2 also shows that new discoveries that are found to be profitable are fast tracked for production development.
The growth in oil prices in recent years has resulted in a positive economic climate for exploration, allowing more prospects to be drilled and thus establishing more reliable estimates of recoverable volumes from these discoveries.
Based upon data in the public domain from the operators and the authorities (NPD), it has been estimated that the recent discovery of Skrugard will be profitable at an oil price around US$60/bbl (340 NOK/bbl) at a discount rate of 7%. Skrugard is now estimated to hold 250 – 280 Mb of recoverable oil and the field is located at 72 degrees North at a water depth of 390 meters (1,300 feet) and 200 kilometers (125 miles) offshore.
One way to look at these recent developments is that Norway in general is about to run out of discoveries that are profitable in the US$40 – US$60/bbl range.
Could a new wave of exploration and developments be set off at an even higher oil price, say US$150/bbl?
Food for thought is that future discoveries and developments are likely to be smaller than those that set off the past and present waves. If new discoveries are smaller, we are likely to need both a higher price and a larger number of field developments to combat depletion and decline from a growing number of ageing fields.
If this is viewed together with the extraction costs for oil from shale (tight oil) mainly in the U.S. and oil sands in Canada which both require an oil price in the range of US$60 – US$90/bbl, this very much documents that the price for the marginal barrel has now moved higher.
There is a catch here. Buyers of oil do not care about the development costs (or required breakeven prices). Instead the market sets the price as primarily based on the supply/demand balance. If the crude oil price were to temporarily retreat this would threaten the economics of some developments and also defer investments in new capacities.
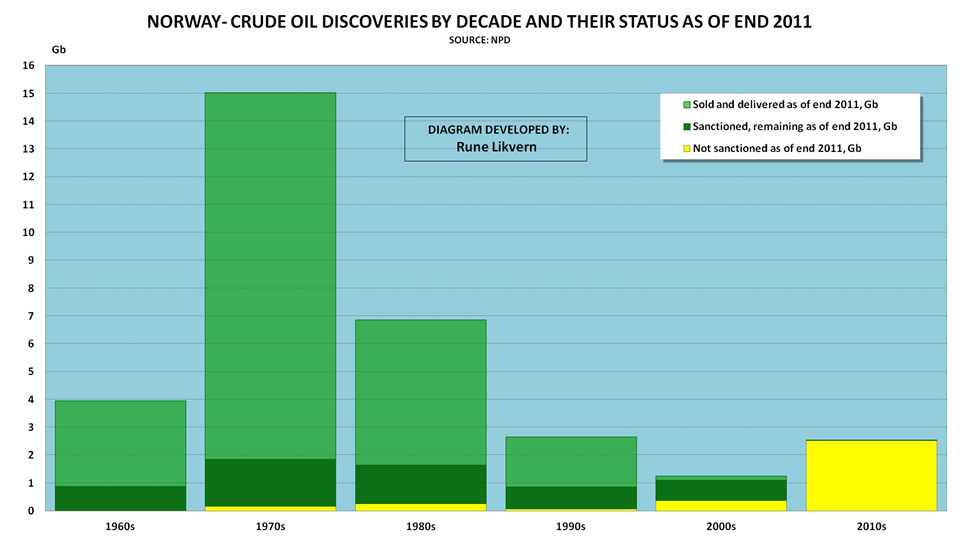
Figure 03: The figure shows the discovery of crude oil for each past decade of oil operations in Norway. The light green bars show what is sold and delivered. Dark green is estimated total remaining reserves. The yellow bars show discoveries that have not been sanctioned as of the end of 2011.
The figure shows that most of Norwegian crude oil was discovered in the seventies and that total discoveries slowed until the discovery of Johan Sverdrup, Skrugard and Havis, and there are still some years left of this decade.

Figure 04: The figure shows the history and total discoveries of crude oil by year (stacked columns) from oil exploration started on NCS and as of year-end 2011. The figure is also referred to as a “creaming curve”. The light green bars shows what has been sold and delivered. Dark green is the total remaining reserves. The yellow bars show the total of discoveries that presently are not sanctioned.
The discoveries from the 70s presently yield more than 28% of total Norwegian oil production, (refer also to Figures 6 and 7), and these will continue to make a significant contribution to the total Norwegian oil production.
Figure 4 shows that discovered Norwegian oil reserves are now around 75% depleted.
Figures 4 and 5 below should be useful for understanding the time horizon and level of future Norwegian crude oil production.
ACTUAL AND A FORECAST OF NORWEGIAN CRUDE OIL PRODUCTION
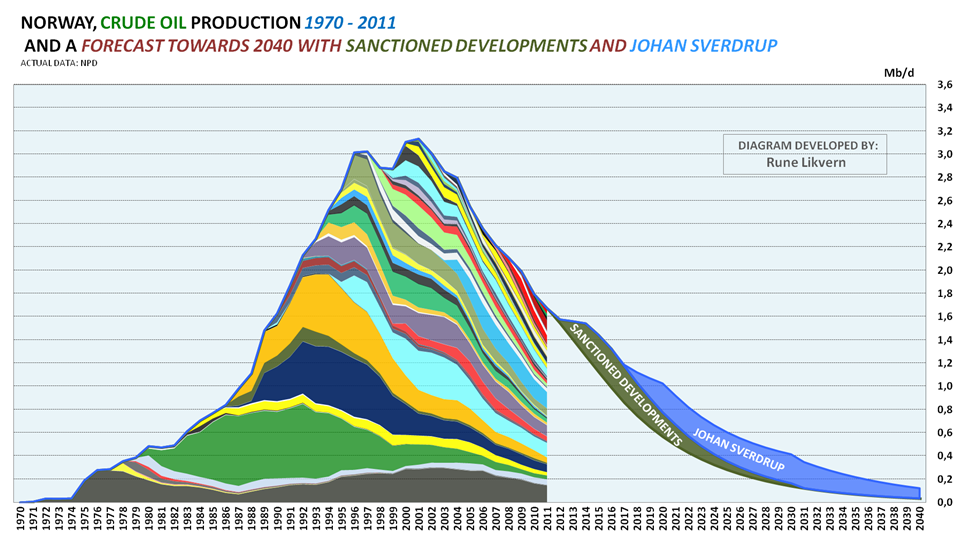
Figure 05: The chart shows actual crude oil production by field from the NCS for the years 1970 to 2011. Furthermore, I have prepared a forecast until 2040 based upon the reserve and resource data from NPD as of end 2011. The forecast is based upon each field’s R/P ratio, projected decline rates for each field, estimated remaining recoverable reserves, sanctioned developments (those shown in Figure 1) and NPD estimates of recoverable reserves for recent discoveries (such as Johan Sverdrup, Skrugard, Havis etc.). The forecast does not incorporate effects from fields that may be closed down as these become unprofitable. The forecast is subject to changes from revisions in estimates of recoverable reserves in producing fields and discoveries, new commercial discoveries in mature areas, the Barents Sea and later Lofoten/Vesterålen.
The parameter that will most influence future Norwegian crude oil production is and will continue to be the oil price. Figure 5 also illustrates that the biggest discoveries are made early, rapidly put into production. Then, with time, as prices rise to a high enough level, the smaller discoveries are developed. Figure 5 shows that the decline in Norwegian crude oil production continues to defy the strong price growth in recent years. The growth in crude oil prices has helped offset the fall in Norwegian crude oil production and stimulated increased exploration activity and made some past discoveries profitable.
In discussions about the time horizon and levels for the Norwegian crude oil production there seems to be a deficit of realistic and unbiased understandings about future production levels relative to what is now publicly known about estimates of remaining recoverable reserves, discoveries and yet to find.
Norwegian crude oil production peaked in 2001 and as of 2012 it has declined about 50% from the peak. This fact has been overshadowed by the oil price growth in recent years. This increase in prices has more than compensated for the decline in the amount of crude sold and delivered (and natural gas volumes), and has helped to maintain and grow annual Norwegian gross income.
Norwegian Petroleum Directorate’s (NPD) has forecast that crude oil production for 2012 will decline to 1.61 Mb/d from 1.68 Mb/d in 2011. Norway also produced 0.08 Mb/d of condensates and 0.28 Mb/d of NGLs in 2011. Norwegian domestic oil consumption is now around 0.2 Mb/d and present expectations are that Norway will continue to be a net exporter of crude oil, albeit at a diminishing rate, for the next 25 to 30 years.
OIL PRICE AND GROSS INCOME
A production level that only meets Norway’s domestic needs will not leave anything for exports. Norway presently has an annual trade deficit, excluding income from the petroleum sector, of around US$20 – US$25 billion.
To run a balanced trade and cover domestic consumption Norway needs to produce 0.7 – 0.8 Mb/d at current prices. This level is presently expected to be reached within 15 years.
(Admittedly, income from Norwegian natural gas sales needs to be included, but in 15 years these sales are also forecast to have substantially declined.)
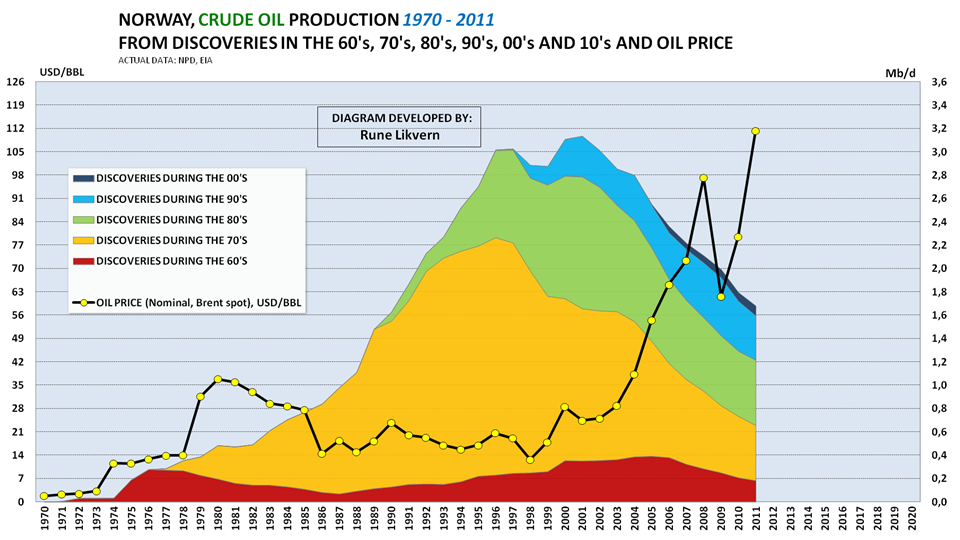
Figure 06: The figure shows the Norwegian crude oil production divided into discoveries by decade. The figure also shows the development of the annual price of oil.
The figure above illustrates the effects from discoveries by decade and that the major discoveries in a new oil province are made early.
The chart could also leave the impression that oil prices really took off as Norwegian oil production started to decline.
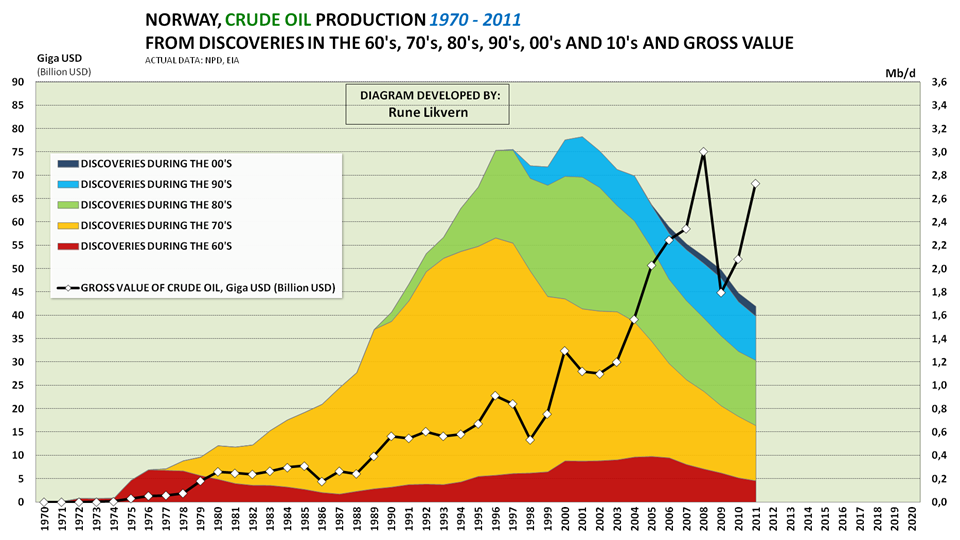
Figure 07: The figure shows Norwegian crude oil production divided into discoveries by decade. The figure also shows the development of the annual gross value of the Norwegian crude oil production in U.S. dollars.
As the oil price moved strongly upwards, it also pulled gross incomes from crude oil sales up. What is often overlooked with this increasing revenue is the decline in volume. The price increase for oil in 1979 gave a boost to the gross income from the Norwegian crude oil sales. Later, the increase in gross income was driven primarily by volume. A tighter global supply/demand balance in 2004 ushered in a sharp rise in prices of oil which more than compensated for the decline in oil production and thus sent the gross income from the Norwegian crude oil production to new heights.
Average crude oil price was around US$97/bbl in 2008 and in 2011 US$111/bbl. In 2008 the Norwegian crude oil production was 2.11 Mb/d and by 2011 it had declined to 1.68 Mb/d.
Predicting near term developments of the oil price with any precision is difficult. The growth in total debt in the last three decades caused aggregate demand (also for oil) to be pulled forward, and debt growth also provided price support. A wide spread deleveraging and introduction of austerity measures, which now seems to be in its infancy, could be expected to affect oil demand in the near term and perhaps reduce oil prices.
Leave a Reply