Peak Oil is You

Donate Bitcoins ;-) or Paypal :-)
Page added on April 16, 2012
March Iranian and Saudi Oil Production

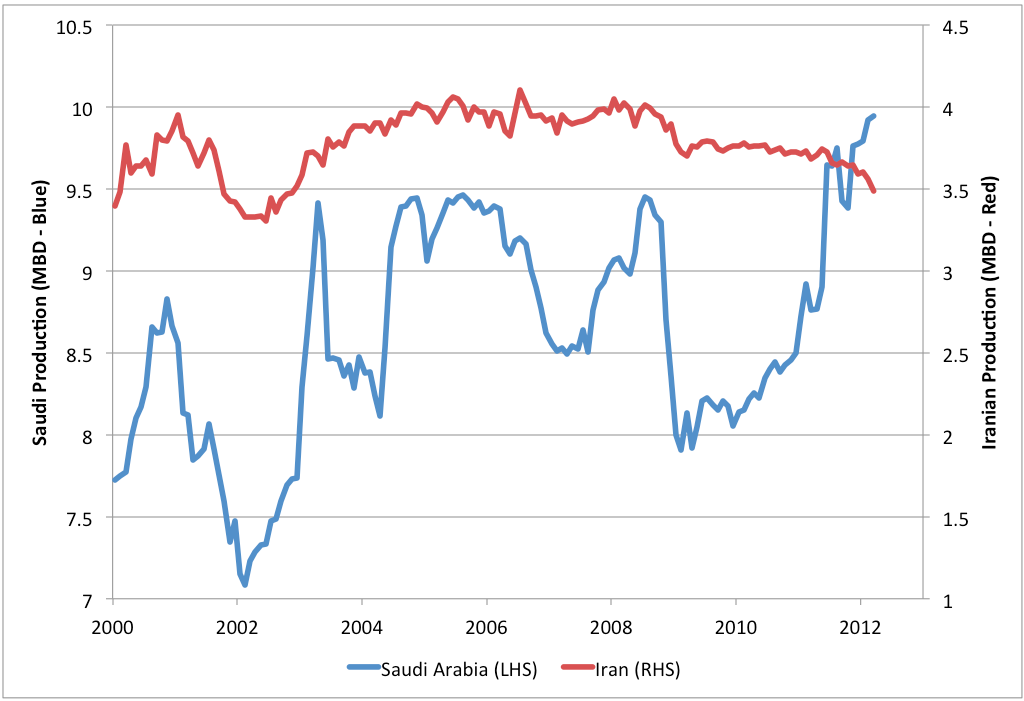
The above graph shows average Saudi oil production (left scale) and Iranian oil production (right scale). Neither side is zero-scaled but they are on the same sized scale (to better show and compare absolute changes). The data point in March is based solely on the secondary sources for the OPEC MOMR but appears to show a continuation of the recent trend of slowly falling Iranian production and roughly compensating rises in Saudi production.
The individual data sources for Iran look like this:

Note the rather wide spread of opinions – this increases the uncertainty about what is really going on.
The individual data sources for Saudi Arabia look as follows:

It’s worth noting that the rig count seems to have notched down in the last couple of months. This weakens the argument of those of us who saw the rising rig count as possible evidence that Saudi Arabia was again near capacity constraints. However, it’s perhaps too soon to draw firm conclusions.
One Comment on "March Iranian and Saudi Oil Production"
BillT on Mon, 16th Apr 2012 2:31 pm
One month does not an increase make. And who verified the numbers?