Peak Oil is You

Donate Bitcoins ;-) or Paypal :-)
Page added on April 12, 2012
What the New 2011 EIA Oil Supply Data Shows

The US Energy Information Administration (EIA) recently released full-year 2011 world oil production data. In this post, I would like show some graphs of recent data, and provide some views as to where this leads with respect to future production.
World oil supply is not growing very much
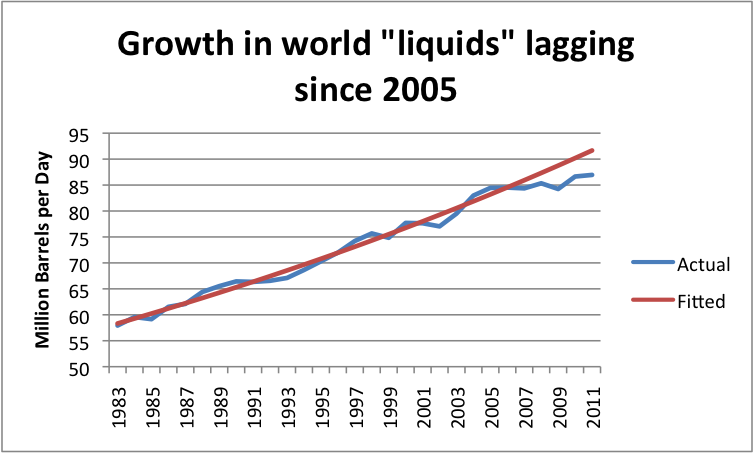
The shortfall in oil production relative to what would have been expected based on the 1983-2005 growth pattern amounted to 4.7 million barrels in 2011. This is far more than any country claims as spare capacity. This is no doubt one of the reasons why oil prices are as high they are now. These high oil prices tend to interfere with economic growth of oil importing nations.
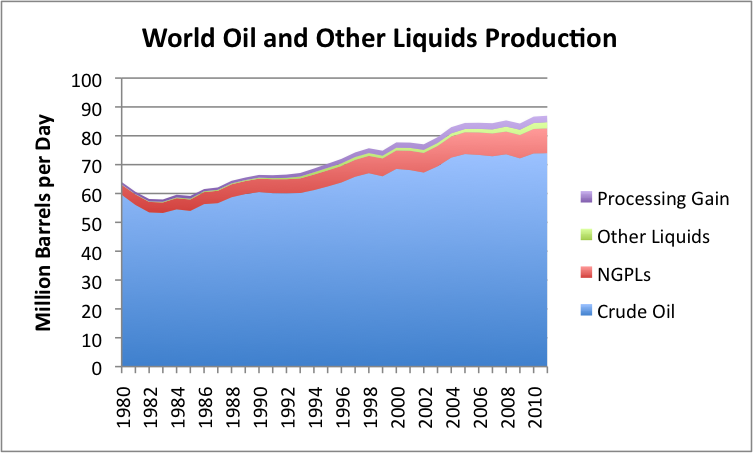
The shortfall in growth especially occurred in crude oil. Figure 2, below, shows crude oil production separately from substitutes.
Top Oil Producers
The top five crude oil producers in 2011, based on the new data are
- Russia – 9.8 million barrels a day (mbd)
- Saudi Arabia – 9.5 mbd
- United States – 5.7 mbd
- China – 4.1 mbd
- Iran – 4.1 mbd
The top five producers when substitute liquids of various kinds are included are the same countries, but in a different order. On this basis, the US also appears to be closer to catching up to the top two.
- Saudi Arabia – 11.2 mbd
- Russia – 10.2 mbd
- United States – 10.1 mbd
- China – 4.3 mbd
- Iran – 4.2 mbd
While substitute liquids are OK, they are not really crude oil. Natural gas liquids are the largest category. In the US, they sell for a little less than half as much as crude oil, based on the composition and costs shown in this post. On an energy content basis, they provide about 70% as much energy per barrel as crude oil.
“Other liquids” has also been growing. It is mostly ethanol, which has about 60% of the energy content of crude oil per barrel. This category also includes biodiesel, liquid fuels made from coal or from natural gas, and even a mixture of water with very heavy oil called “Orinoco emulsion“.
There is also growth in “processing gain”. This term refers to the extra volume that is gained when long hydrocarbons of heavy oil are”cracked” into shorter molecules. The EIA assigns this growth back to the country doing the refining. The US comes out ahead in this comparison because it imports a lot of heavy oil, and uses its complex refineries to crack it into shorter chains, such as diesel fuel and gasoline. If the heavy oil imports were to go to another country with complex refineries (such as China), the processing gain would go with it.
Looking at the Top Five Oil Producers
Of the top five oil producers, only the US and China have been growing very rapidly, and China’s growth now seems to be hitting limits. Let’s look at the five largest countries individually.
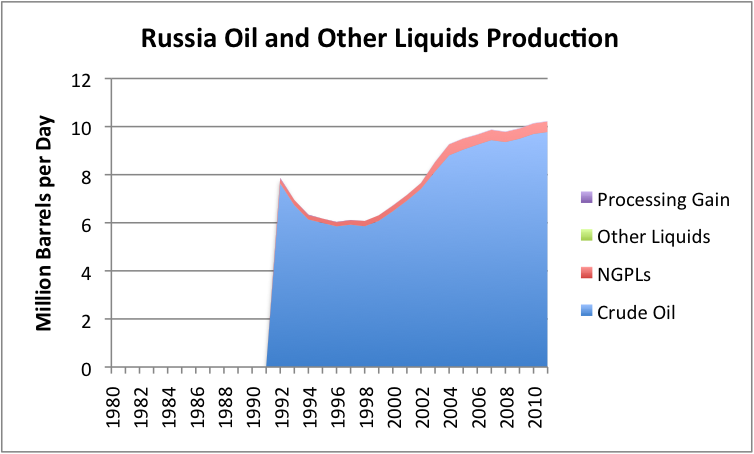
Russian Oil Production
Between 2005 and 2011, Russia’s oil production (including substitutes) grew by 7.5%. This is better than the world average of 3.0%, but still falls short of the expected growth between 2005 and 2011 of 10.2%, mentioned above, based on the 1983 to 2005 world growth pattern.
Saudi Arabian Oil Production
Figure 4 (below) shows that Saudi Arabia’s oil production has not increased much on an annual basis since 2005.

Saudi Arabia’s oil production bounces around. Admittedly, for some individual months, Saudi Arabia has broken its own record for crude oil production, but there is no pattern of continuously increasing production, such as is needed to increase world oil supply.
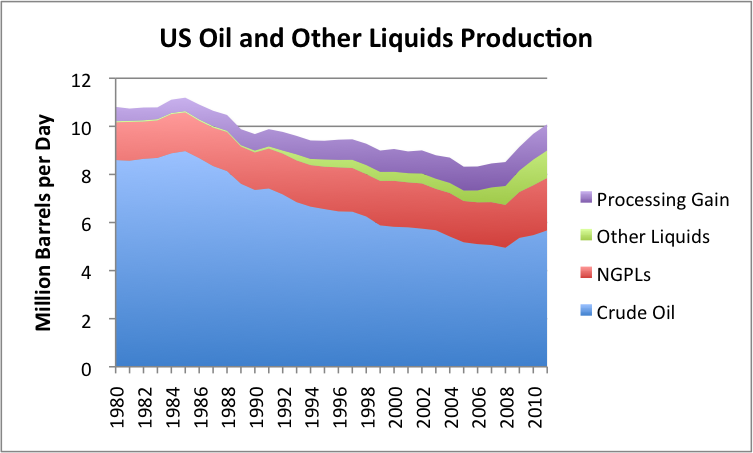
United States Oil Production
US oil production is growing (total liquids supply increased by 21.2% between 2005 and 2011), but the major portion of the growth is coming from oil substitutes.
If we look at US crude oil production by area of the country, we see that while Bakken production in North Dakota has been growing, it is still a small proportion of US total production.
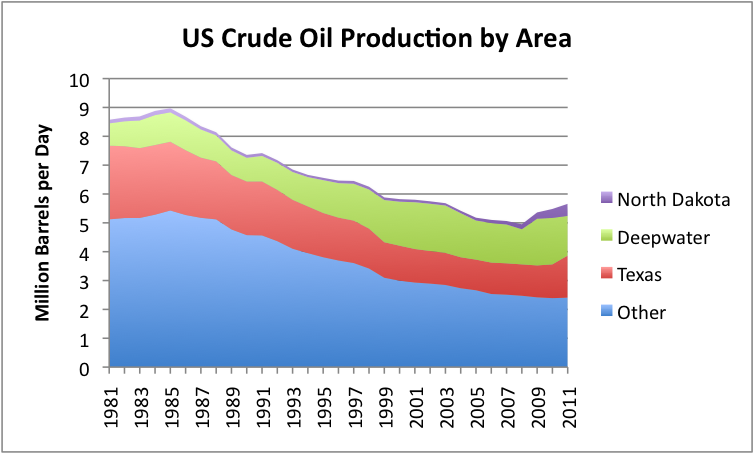
The other recent area of oil production growth is Texas. While EIA data does not break the production out by field, higher production from the Eagle Ford shale and the Permian Basin are likely major contributors.
China’s Oil Production
China’s oil production plateaued in 2011, after many years of strong growth.

If China’s oil production fails to grow in the future, or declines, it means that China will need to import even more oil than it has in the recent past. This will put even more pressure on world oil supply.
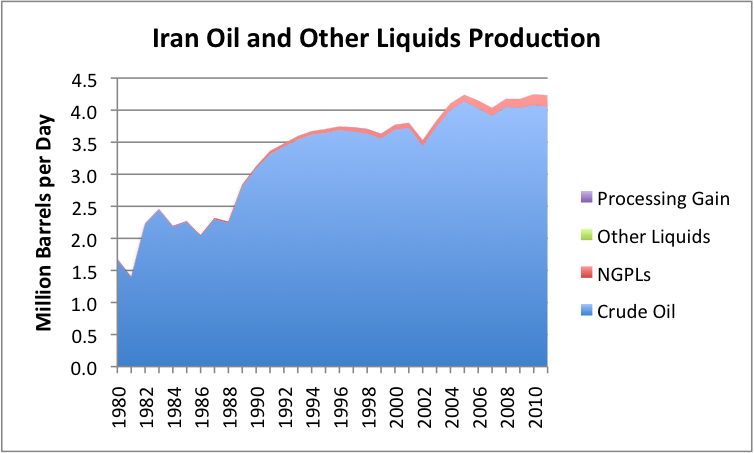
Iran’s Oil Production
Iran is constantly in the news with discussions of more sanctions and the possibility of cutting off Iran’s oil exports. While it is listed above as fifth in world oil production, it is almost tied with China for fourth in world oil production.
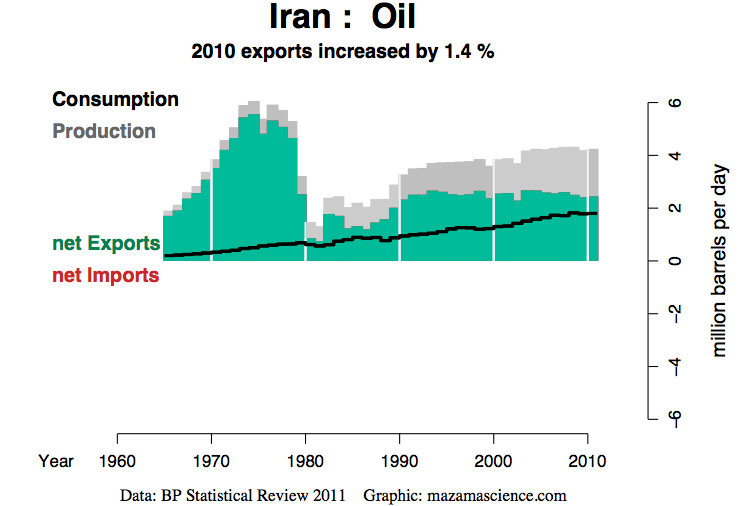
In my view, Iran’s oil exports of over 2 million barrels a day are very much needed to maintain reasonable stability in world oil prices. We would be better off finding a different way to settle our differences with Iran than cutting off exports.
Other Areas of Interest
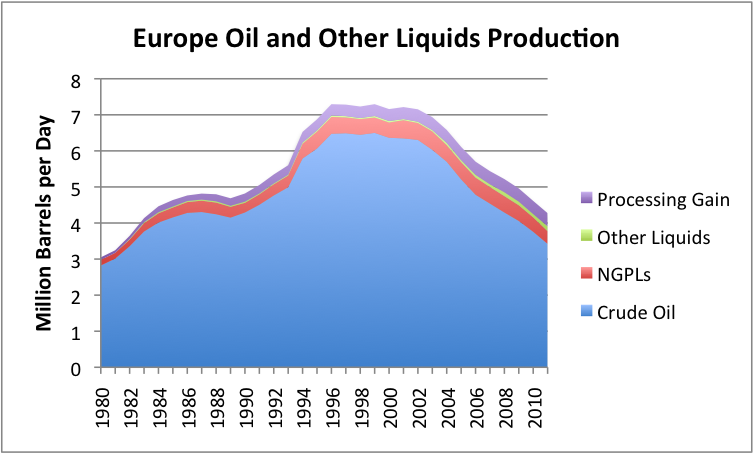
The North Sea has been a problem area, with declining production. EIA data does not show this grouping separate. Instead it shows data for Europe in total.
Europe has surprisingly low oil production. On a crude oil basis, Europe’s 2011 production is below that of Iran (3.4 mbd for Europe, and 4.1 mbd for Iran). With the various substitutes included, Europe’s production is approximately equal to that of China – 4.3 mbd, and slightly ahead of Iran’s at 4.2 mbd.
In contrast to Europe, there are a number of bright spots with respect to world oil supply.
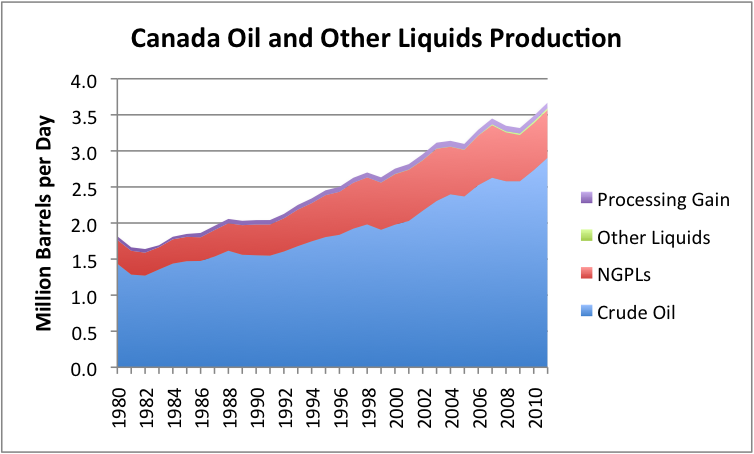
Canada’s oil supply is increasing:
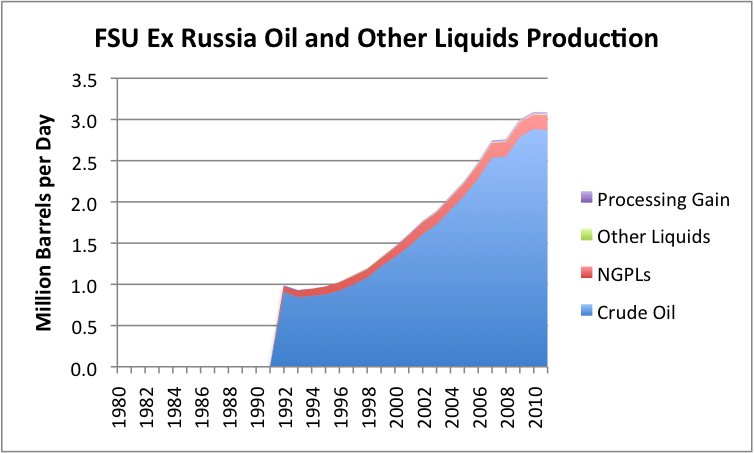
The Former Soviet Union excluding Russia is another area where production has been increasing, at least until recently.
Qatar is a small country, but is showing rapidly increasing production from a small base:

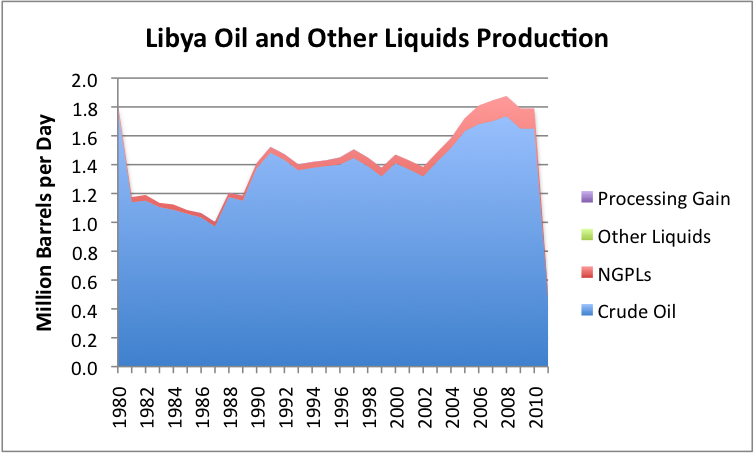
Libya is mentioned as having a possibility of increasing production, at least relative to the drop off in 2011.
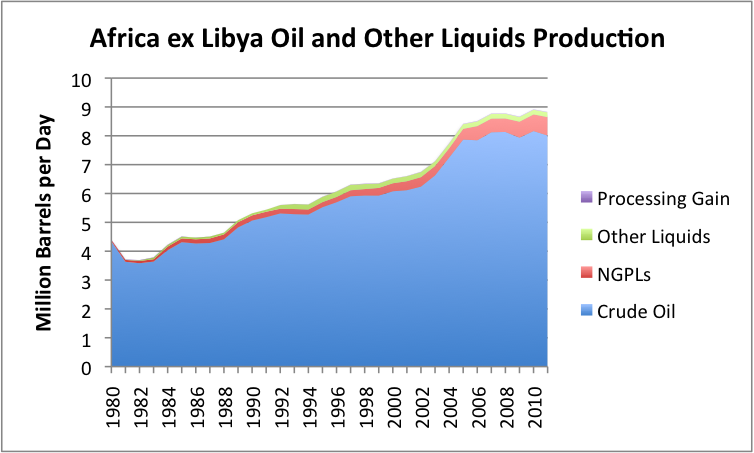
Various African countries are mentioned from time to time as providing new sources of production. But when we look at African production, excluding that of Libya, we see that at least so far, African production, excluding Libya, is on a plateau.
Conclusions
It is easy to find small opportunities where it looks possible to increase oil production, but on a world-wide basis, it appears likely that at best, very slow growth will continue. The oil production of China and Russia were previously increasing, but now seem to be hitting plateaus. Even smaller groupings, such as the FSU excluding Russia, seem to be hitting plateaus.
Future prospects for oil supply look to be worse, especially if Iranian exports are taken off line, or if there are unexpected surprises on the downside. One concern is that political disruptions may take oil production offline in additional countries. Anther is that financial disruptions (perhaps related to European debt defaults) may lead to lower oil prices, cutting off some marginal supply.
On balance, it would appear that at best, oil production in the near future will be virtually flat, leading to more spiking of oil prices and greater world economic problems. Another possibility is that world production will begin to decline. The likelihood of decline would appear to be increased if more oil exporters encounter political disruptions, or if the world enters a major recession leading to an oil price decline.
7 Comments on "What the New 2011 EIA Oil Supply Data Shows"
MrEnergyCzar on Fri, 13th Apr 2012 12:04 am
Wow, the early graphs in the beginning really show the 5 year crude plateau the world has been in….
MrEnergyCzar
Max Reid on Fri, 13th Apr 2012 1:22 am
I did the calcs. Here is the summary for Year 2011
Crude & Condensate grew 0.1 %
Natural Gas Liquids grew 1.96 %
Other Liquids grew 2.53 %.
So all 3 put together grew 0.35 %.
This clearly shows that Oil Consumption could not increase and that’s why it trades at $122 / barrel (Brent Benchmark).
BillT on Fri, 13th Apr 2012 2:04 am
This is close to a graph that I would like to see. One that uses the energy values to chart actual energy growth/loss over the last 10 years or so. From the numbers above, I would guess that total NET energy produced has been shrinking long before oil production leveled out. If we were to go to all biofuels, at 60% fuel efficiency, the fact that we cannot keep liquid energy levels growing would be obvious.
Max Reid on Fri, 13th Apr 2012 2:43 am
There is very big difference between EIA Stats and BP Stats.
If I look at the BP Stats for Oil Production for 2010, its 3,913 million tons, but as per EIA estimate, its 3,679 million tons in 2010.
So the balance of 234 million tons (1.7 million b/d) is it coming from Synthetic Oil (like Shale and Tar Sands).
SOS on Fri, 13th Apr 2012 12:31 pm
This information is missleading and wrong. Why do we have all the oil we need? Why do world invintories always supply everyone with what they need? The fact is with orderly development promoted by government policies that encouraged developement and use of hydro carbons from federal lands we would have cheaper abudnent energy supplies, increased revenues large enough to fund social security and pay the national debt and keep the federal budget balanced.
Arthur on Fri, 13th Apr 2012 9:21 pm
Here is a link to the source that might work:
http://ourfiniteworld.com/2012/04/09/what-the-new-2011-eia-oil-supply-data-shows/
Erroneous link in article:
http://ourfiniteworld.com/2012/04/09/what-the-new-2011-eia-oil-supply-data-shows/http:/
BillT on Sat, 14th Apr 2012 1:35 am
SOS…you are so incorrect…lol.