Peak Oil is You

Donate Bitcoins ;-) or Paypal :-)
Page added on July 4, 2011
Crude Oil Price Could Double

We have not written anything about the bull market in Crude since November. And that piece was more directed toward Natual Gas, which continues to drift along with a slight upward bias. We are not going to get into the fundamentals that are driving Crude prices higher; i.e. peak oil, quantitative easing, tax issues and simply growing energy demand from the emerging economies. This is more of a technical report using the principles of OEW with price and cycle analysis.
Commodities move in 34 year cycles: 13 years up and 21 years down. The reason this occurs has a lot to do with FED policy, the 68 year interest rate cycle and the 34 year currency cycle. The bellwether for this 13 year cycle is Gold, which bottomed in 2001. A search on selected charts or special reports, on this website, will produce some additional information about these cycles.
Typically commodities experience an ABC type bull market. Commodities are mainly driven by supply/demand, while stock markets are mainly driven by economic growth. The only exception to an ABC commodity bull market, that we are aware of, is Gold and Silver. The following chart displays the price action in Crude since the 1998 low at about $11.00. Notice the five Major wave advance from 1998 to 2008: $11.00 – $146.00. This completed Primary wave A of this Cycle wave bull market. Next came the collapse in the world’s economy in 2008. Crude dropped, in a matter of months, down to $35.00. This was Primary wave B. The prices quoted are daily closing prices in a continuous contract. Since that 2008 low, Crude has been advancing in another five Major waves. When these five waves conclude, probably around 2014, Crude will have completed its entire bull market in an ABC consisting of three Primary waves.

Recently Crude hit a high of $114 to end Major wave 3. Then sold off sharply down to a June low of $91. This recent low may have ended Major wave 4. It was sufficiently oversold on the weekly RSI, and nearly so on the weekly MACD, (we like to see the MACD touch neutral during major corrections). If the low is indeed in we can now make some fibonacci calculations, which should produce resistance levels, for the rest of the bull market.
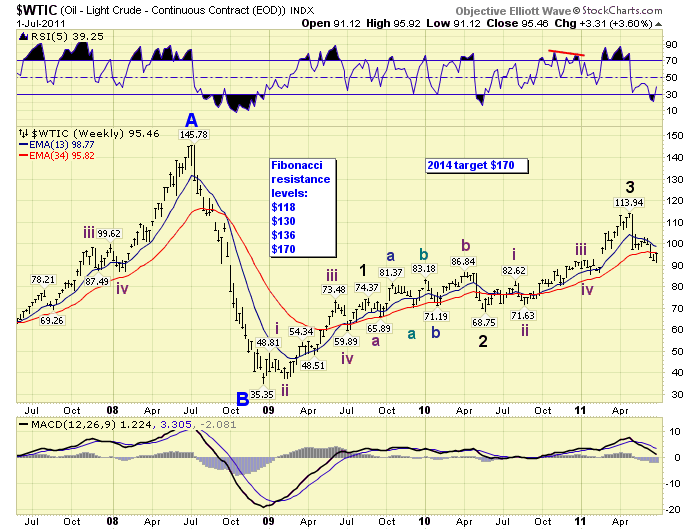
First, Primary wave A rose $135: at $118 Primary C = 0.618 times Primary A, then at $170 Primary C equals Primary A. Second, Major wave 1 was $39 and Major wave 3 was $45. At $130 Major wave 5 equals Major wave 1. At $136 Major wave 5 equals Major wave 3. Then at $170 Major wave 5 equals Major wave 1 through 3. This analysis suggests future resistance at the following levels: $118, $130, $136 and then a cluster at $170. Therefore, we expect Crude will end its bull market at $170 on the continuous contract closing price basis. It could shoot up to $180 on an intraday basis, the reason for the potential double.
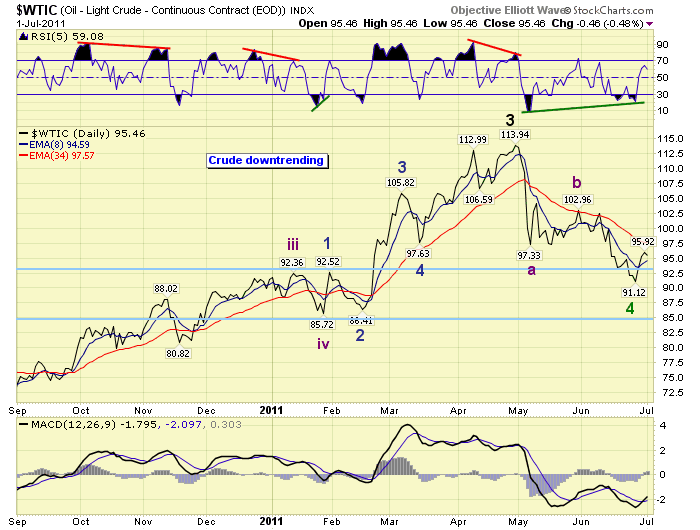
The above chart displays the daily price action since September 2010. Notice the negative RSI divergences at short term and medium term tops, plus the positive divergences at medium term lows. You can observe this correction was much steeper, and more complex, than Intermediate wave iv in January. Also the decline came right into an important support zone between Intermediate waves iii and iv. Then at the recent low we had a positive divergence between Intermediate wave A (May) and Intermediate wave C (June). This is a classic bottoming pattern in OEW analysis.
CHARTS: http://stockcharts.com/…
http://caldaroew.spaces.live.com
After about 40 years of investing in the markets one learns that the markets are constantly changing, not only in price, but in what drives the markets. In the 1960s, the Nifty Fifty were the leaders of the stock market. In the 1970s, stock selection using Technical Analysis was important, as the market stayed with a trading range for the entire decade. In the 1980s, the market finally broke out of it doldrums, as the DOW broke through 1100 in 1982, and launched the greatest bull market on record.
Sharing is an important aspect of a life. Over 100 people have joined our group, from all walks of life, covering twenty three countries across the globe. It’s been the most fun I have ever had in the market. Sharing uncommon knowledge, with investors. In hope of aiding them in finding their financial independence.
3 Comments on "Crude Oil Price Could Double"
RICHARD RALPH ROEHL on Tue, 5th Jul 2011 10:29 am
There is statistics… and then there’s damn statistics. The same holds true for the mathmatical abstractions of charting. Okay! Here’s a little advice for economists and staticians, pasty face folks who don’t take time off for fishing or riding a bike… or maybe smelling the flowers of the fields.
In the real world… prescience from gut feelings and wisdom born from common horse sense always trumps statistics and charts, the illusionary madness of “the experts.”
Oh… ah… one more thing. By 2050… the United $tates of Perpetual War Profiteering (and Mindless Consumption) will NOT exist. And by 2100… most humans the Earth host organism will be dead! Indeed! WHERE THERE IS NO INSIGHT, THE PEOPLE PERISH!
oldcutlas on Tue, 5th Jul 2011 4:07 pm
word of advise to economists.. try explaining this stuff in english. I honestly only understood about half of what was written here. the average joe cannot comprehend “enron” math.
Ian Cooper on Tue, 5th Jul 2011 4:31 pm
“Prescience from gut feelings”? “Horse sense”? Yeah, those methods have always proven to be REAL reliable. I always base my business decisions on my intestines or the brainpower of local livestock, rather than rely on people who have spent years or even decades studying mathematical outcomes in the real world. I mean what could go wrong?
Jeez!