Peak Oil is You

Donate Bitcoins ;-) or Paypal :-)
Page added on December 10, 2022
August Non-OPEC Oil Production Increases

Below are a number of Crude plus Condensate (C + C) production charts, usually shortened to “oil”, for Non-OPEC countries. The charts are created from data provided by the EIA’s International Energy Statistics and are updated to August 2022. This is the latest and most detailed world oil production information available. Information from other sources such as OPEC, the STEO and country specific sites such as Russia, Brazil, Norway and China is used to provide a short term outlook for future output and direction for a few countries and the world. The US report has an expanded view beyond production by adding rig and frac charts.
August Non-OPEC oil production increased by 138 kb/d to 49,879 kb/d. The largest increases came from Norway 147 kb/d and Brazil 124 kb/d. The largest offsetting decrease came from Kazakhstan 179 kb/d.
Using data from the December 2022 STEO, a projection for Non-OPEC oil output was made for the time period September 2022 to December 2023. (Red graph). Output is expected to reach 50,603 kb/d in December 2023, 337 kb/d higher than reported in the previous post.
Note that the September 2022 post pandemic high of 50,998 kb/d is the high for all of 2022 and 2023.
The red capacity decline line represents a two point average decline rate for Non-OPEC countries over the four years since December 2019 and is a combination of the natural decline rate plus possible reduction in exploration and production investment.
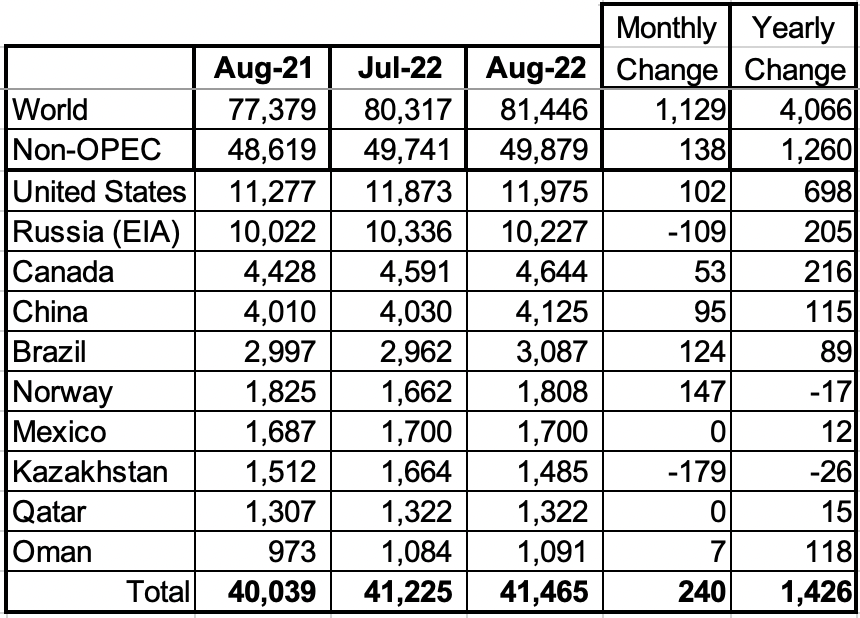
Listed above are the World’s 10th largest Non-OPEC producers. The criteria for inclusion in the table is that all of the countries produced more than 1,000 kb/d. Only Russia and Kazakhstan experienced a production drop in August. The August increase for these ten Non-OPEC countries was 240 kb/d while as a whole the Non-OPEC countries increased output by 138 kb/d.
In August 2022, these 10 countries produced 83.1% of the Non-OPEC oil. On a YoY basis, Non-OPEC production increased by 1,260 kb/d. World YoY August output increased by 4,066 kb/d.
Non-OPEC Production Charts
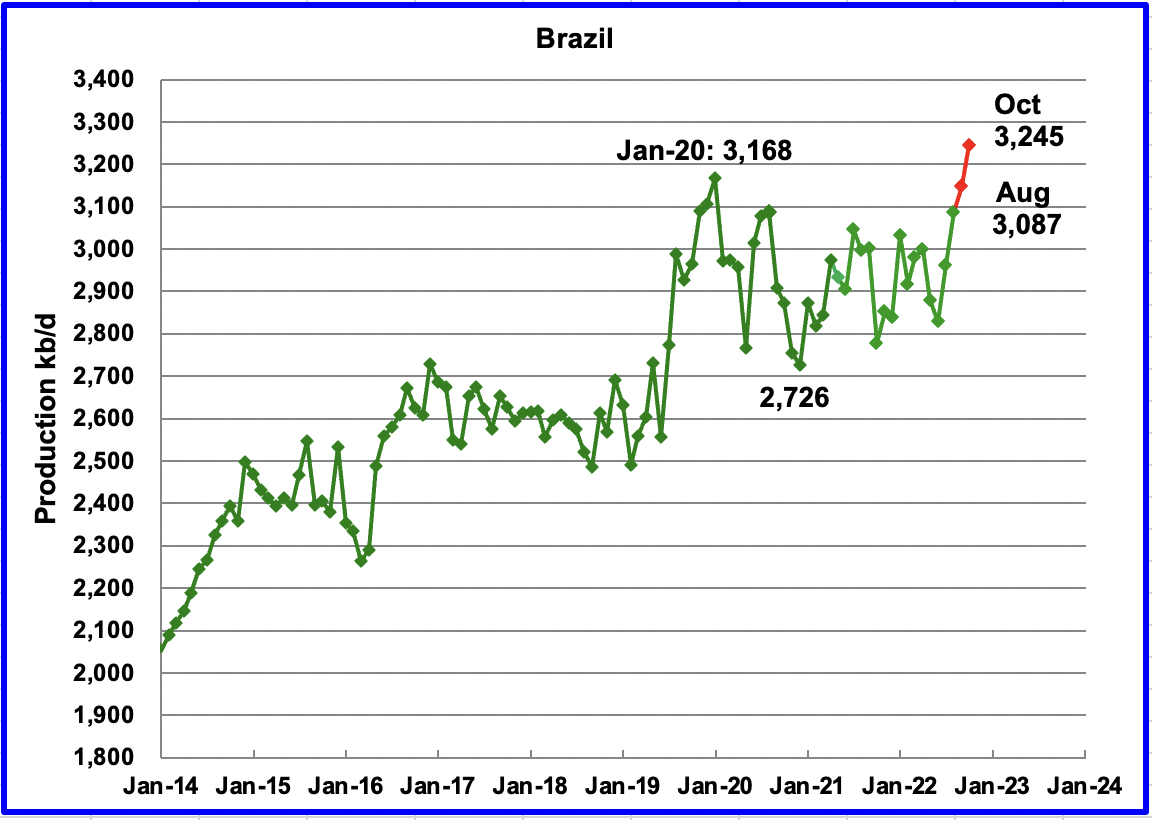
The EIA reported Brazil’s August production increased by 124 kb/d to 3,087 kb/d.
Brazil’s National Petroleum Association (BNPA) has resumed reporting Brazil’s monthly production. September’s output increased by 61 kb/d while October added an additional 97 kb/d to 3,245 kb/d. October’s production was a new record high for Brazil.
According to OPEC: “Crude and condensate production rose for the third consecutive month through September, as offshore maintenance eased and new projects, mostly fields under production-sharing contracts, continued to ramp up production.
Crude oil output is set to increase through production ramp ups in the Mero (Libra NW), Buzios (Franco), Tupi (Lula), Peregrino, Sepia, Marlim and Itapu (Florim) fields. However, offshore maintenance is expected to cause interruptions in major fields.
Much of Brazil’s production growth will be from the sub-salt frontier, where highly productive reservoirs containing light and low sulphur oil have been explored.”
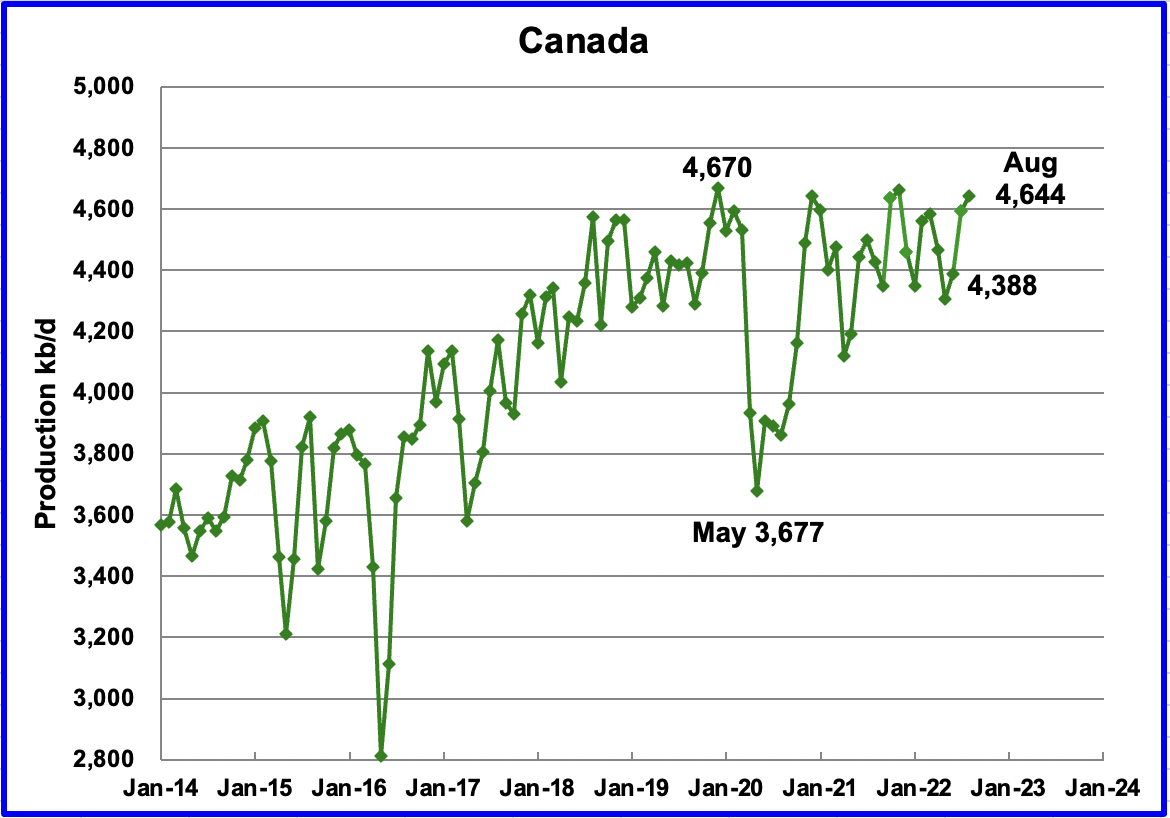
According to the EIA, Canada’s August output increased by 53 kb/d to 4,644 kb/d.
The Canada Energy Regulator reported August output of 4,940 kb/d, 296 kb/d higher than the EIA due to a difference in the definition of condensate. Preliminary estimates indicate that Canadian production could drop by 500 kb/d in September.
Rail shipments to the US in August were essentially flat at 155 kb/d but dropped 28 kb/d in September to 127.6 kb/d.
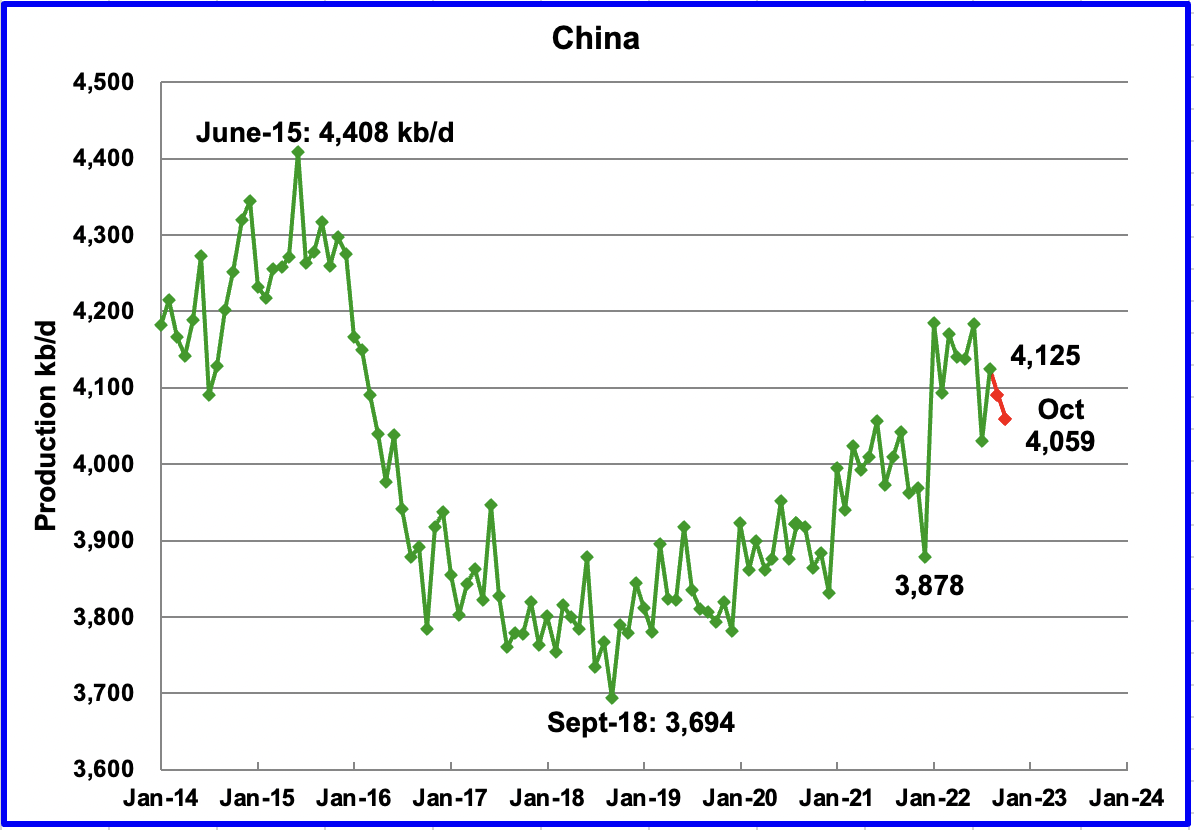
The EIA reported China’s output increased by 95 kb/d to 4,125 kb/d in August.
This August EIA production report is the first time there has been a disagreement between the official Chinese report and the EIA regarding China’s oil production. Up to July 2022, the EIA report and the China report were spot on. The National Bureau of Statistics of China published the following statement for August production, “In August, it produced 16.94 million tons of crude oil, a year-on-year decrease of 0.2 percent, an increase of 3.0 percent in the previous month, and the average daily output was 546,000 tons.”
Using 7.3 barrels per ton, the August output of 16.94 million tons coverts to 3,989 kb/d and the 546,000 daily tons converts to 3,986 kb/d. The EIA report is 139 kb/d higher than the China report. Note that the above China statement refers to crude production. The EIA may now be adding some condensate to the China Bureau “crude” production. We will continue to track this sudden change between the EIA and the China Bureau of Statistics.
The official China bureau reported that China’s output decreased in September to 4,090 kb/d, a drop of 35 kb/d. (Red markers). October output experienced a further drop to 4,059 kb/d.
China may be close to its current maximum production level of approximately 4,000 kb/d to 4,200 kb/d. To offset declines, the national oil company is investing in conventional wells, deep water wells and is also drilling for shale oil.
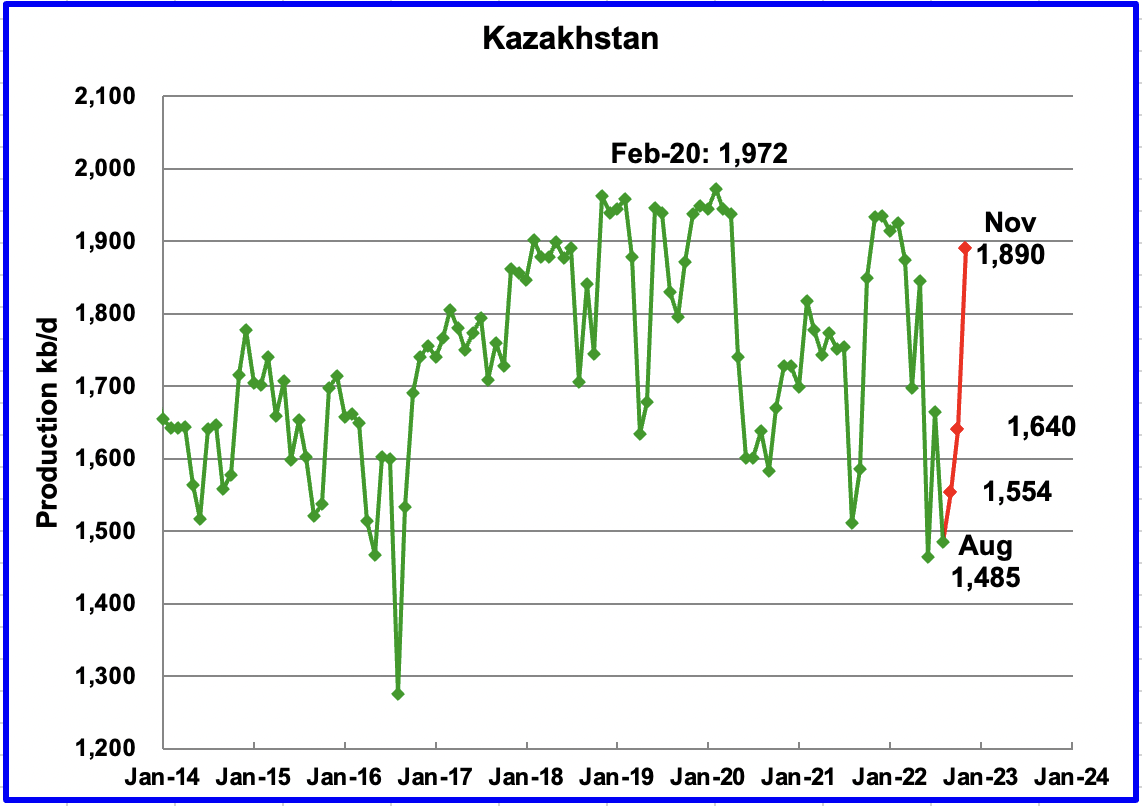
Kazakhstan’s output decreased by 179 kb/d in August to 1,485 kb/d.
According to OPEC, “The fall in output was due to a sharp decline in production in the giant Kashagan oil field after a gas leak early in August, as well as planned output curbs in the Tengiz field due to regular maintenance.”
According the this source, “production at Kashagan, one of the world’s largest oil fields, sharply declined on Aug. 3 due to a gas release. Kashagan had planned to boost output to 500,000 bpd after upgrades.”
Production is expected to recover in October according to this source. Production was restored in late October after the gas leak was repaired and reached 1,890 kb/d in early November, an increase of 405 kb/d over August.
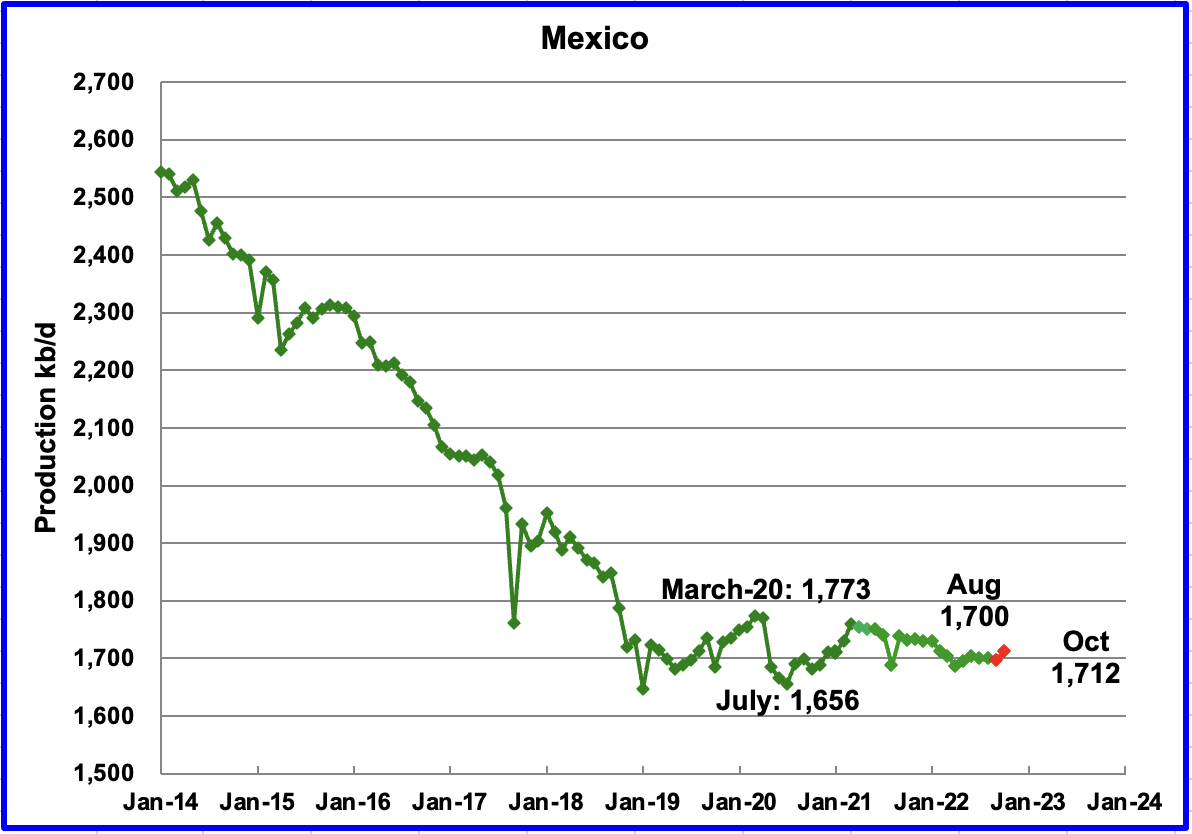
Mexico’s production as reported by the EIA for August was unchanged at 1,700 kb/d.
Data from Pemex showed that September’s output was 1,776 kb/d and October was 1791 kb/d. However, the EIA is expected to reduce Pemex’s September and October oil production by close to 85 kb/d due to a difference in definition for condensate. The September and October estimates, red markers, were obtained by using the Pemex increments over August production and adding those to the EIA’s August output.
OPEC continues to forecast flat production for Mexico due to decline rates in mature fields.
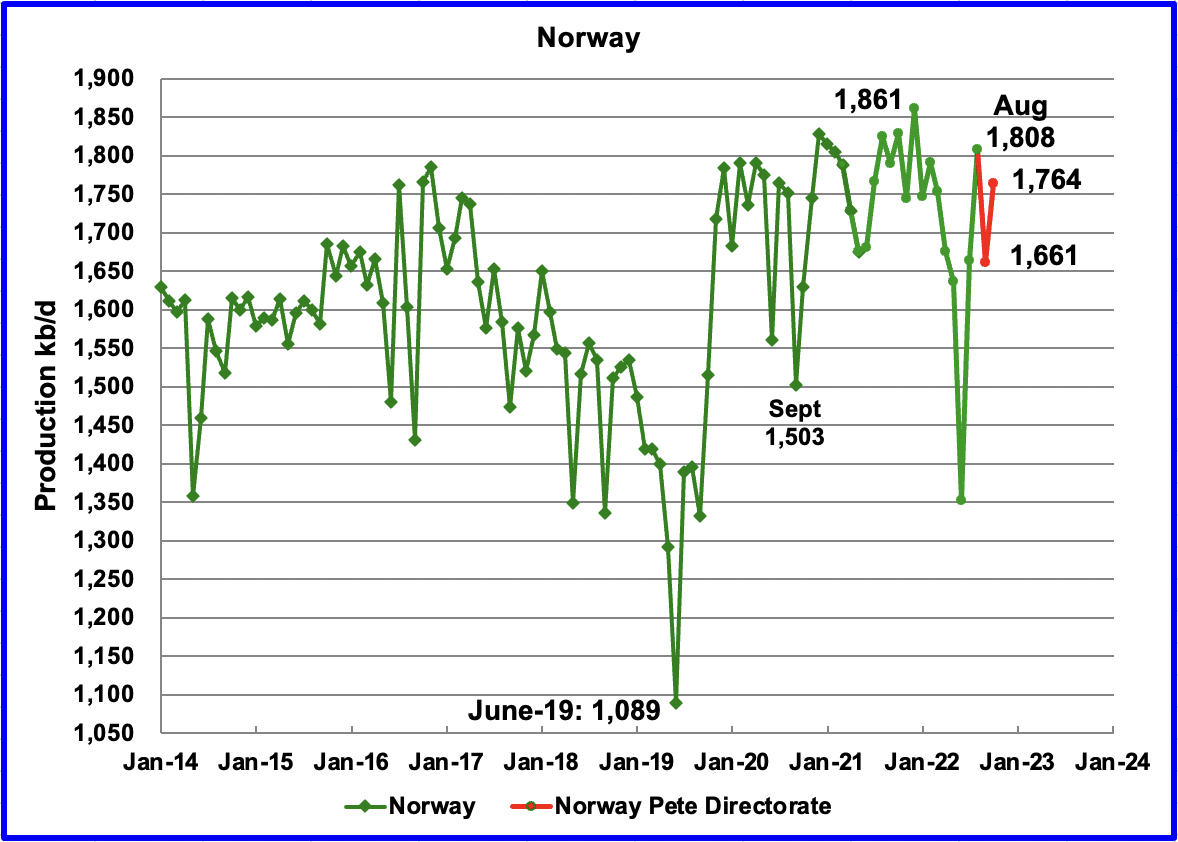
The EIA reported that Norway’s August production increased by 147 kb/d to 1,808 kb/d. Production dropped to 1,661 kb/d in September due to maintenance in the Oseberg and Troll fields.
The Norway Petroleum Directorate (NPD) reported that production increased from September to October to 1,764 kb/d (Red markers). According to the NPD: “Oil production in October was 7.3 percent lower than the NPD’s forecast and 5.4 percent lower than the forecast so far this year.”
Growth is expected in late 2022 and into 2023 when the second phase of the Johan Sverdrup field development starts production and other small fields come on line. According to OPEC “The Johan Sverdrup Phase 2 is projected to be the main source of increased output for later this year and next year. Equinor has not yet provided a firm start-up date for this phase beyond a fourth-quarter window.
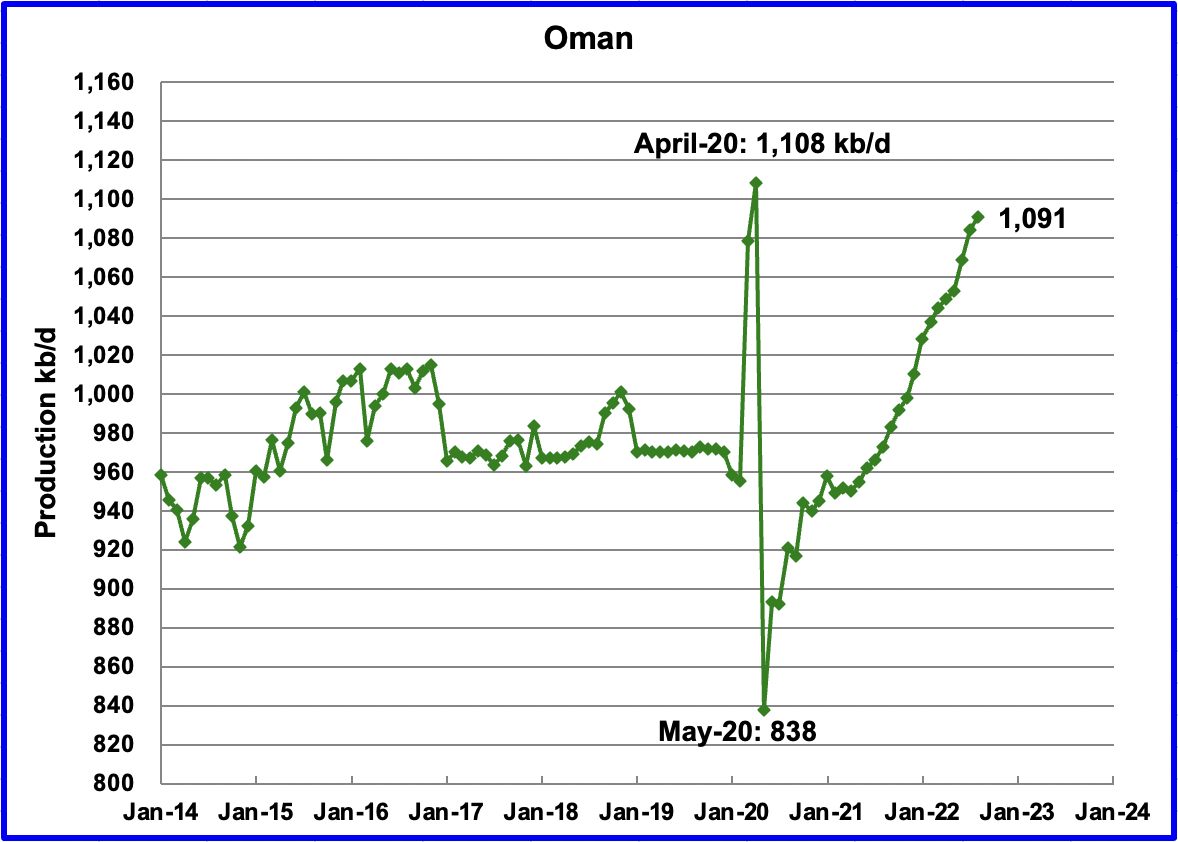
Oman’s production has risen very consistently since the low of May 2020. Oman’s August production increased by 7 kb/d to 1,091 kb/d. It is 17 kb/d short of its pre-pandemic high.
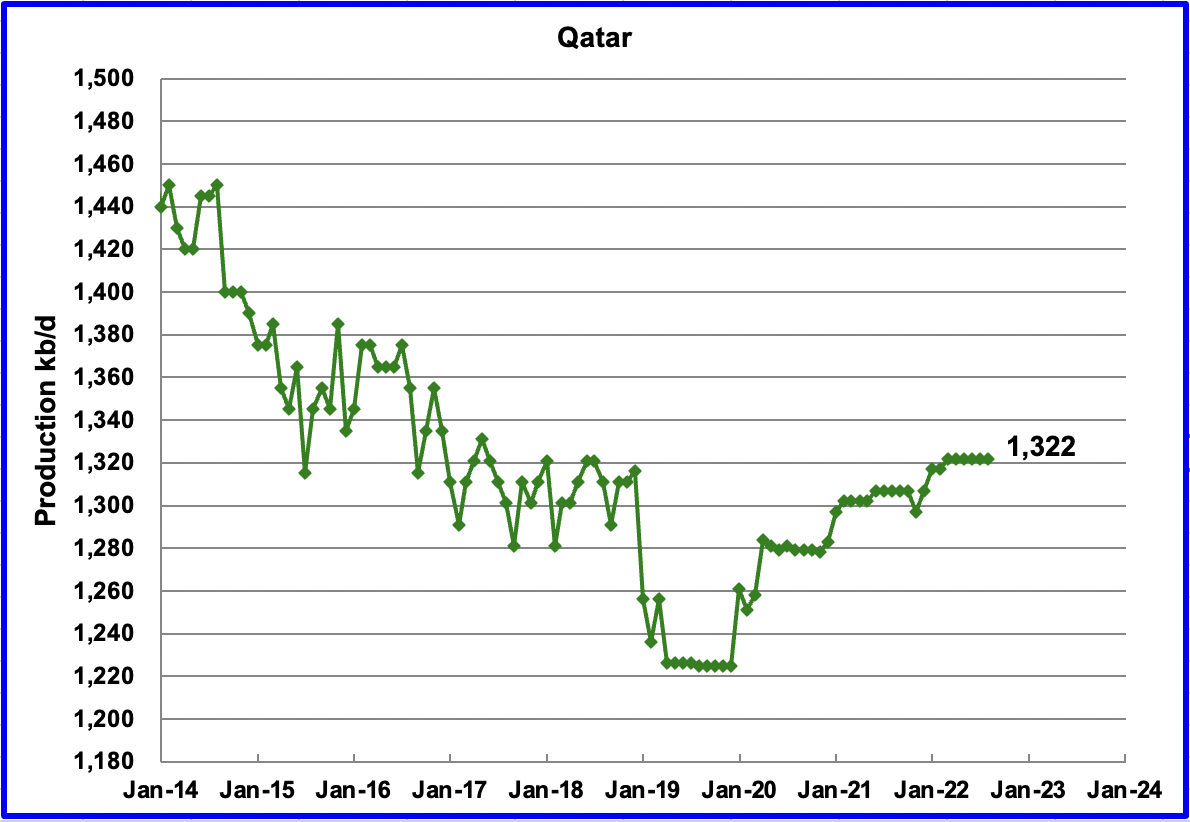
August’s output was unchanged at 1,322 kb/d.
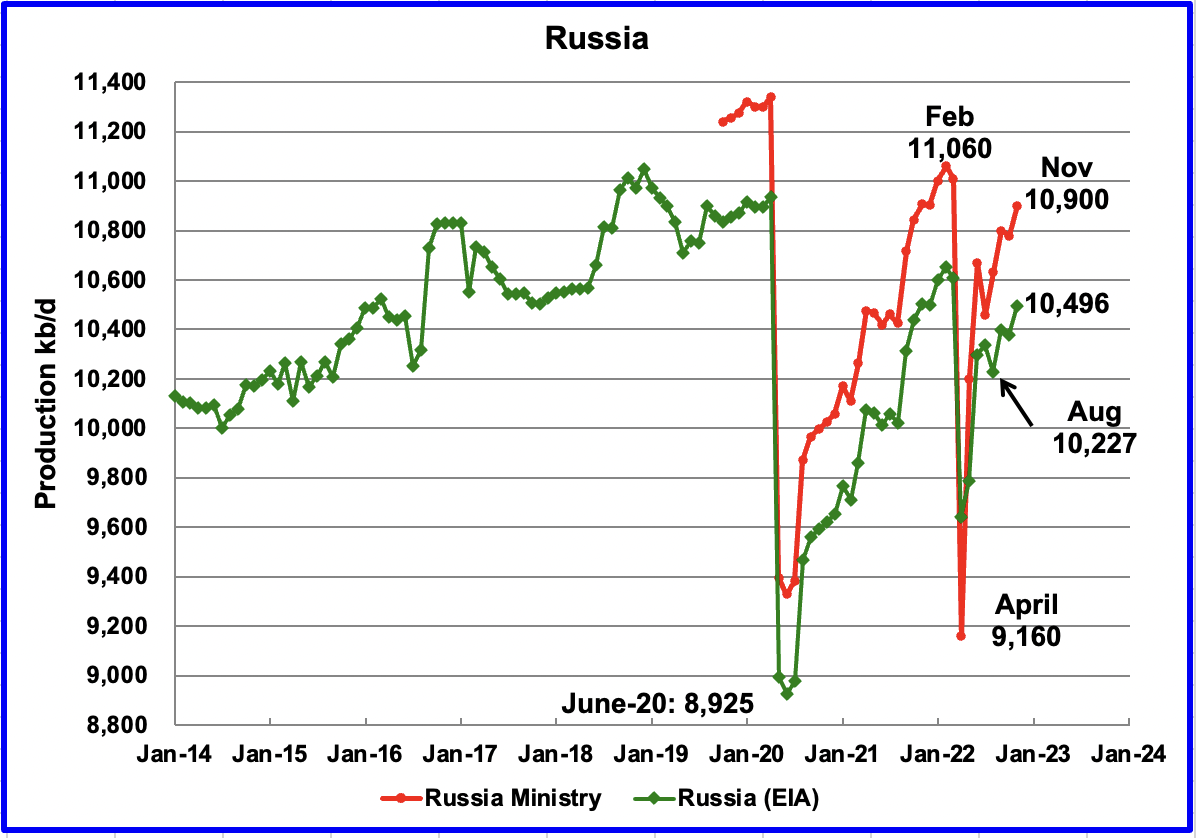
The EIA reported that Russian output decreased by 109 kb/d in August to 10,227 kb/d.
Russia Ministry data for September 10,800 kb/d and October 10,780 kb/d was taken from this source. November production of 10,900 kb/d was taken from this source. In light of all of the sanctions, it is surprising to see such robust production.
The EIA numbers for September to November are derived from the Russia Ministry data by subtracting 404 kb/d. In the past, when production data was obtained directly from the Russian Energy Ministry, it was found that the EIA arbitrarily subtracted 404 kb/d from the Ministry data.
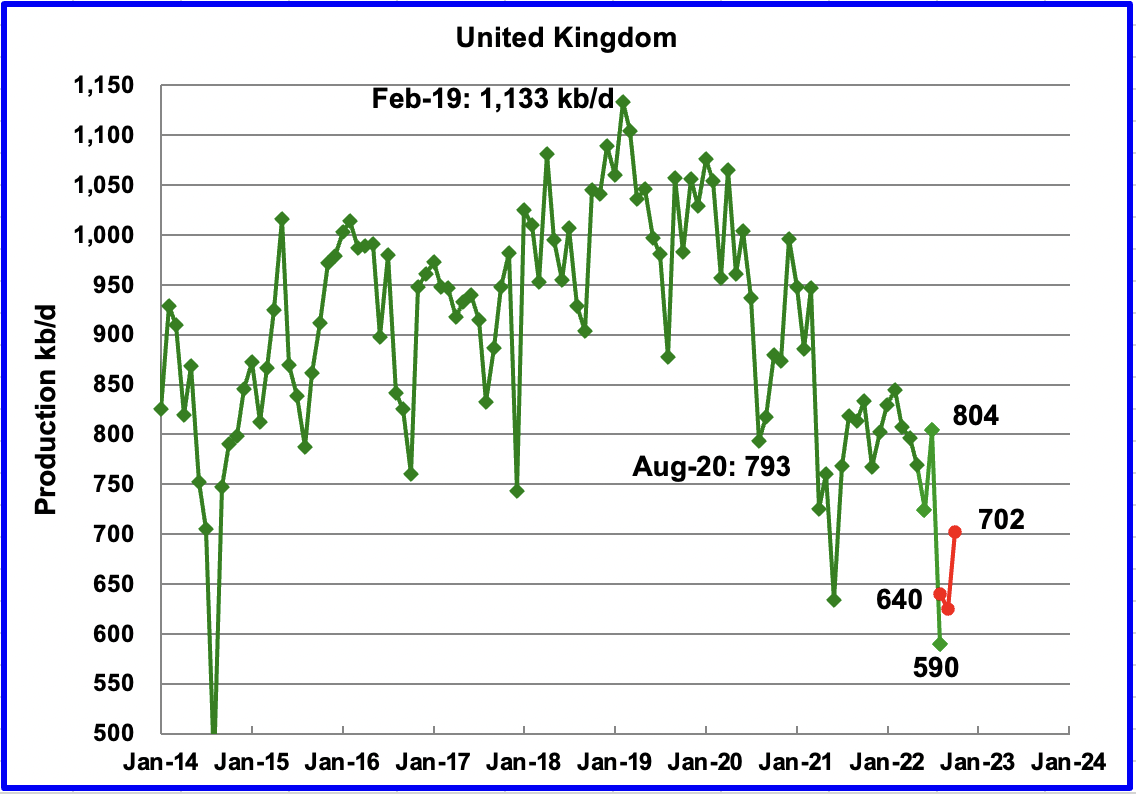
The EIA reported UK’s production decreased by 214 kb/d in August to 590 kb/d.
According to this source, North Sea Transition Authority (NSTA), August’s production decreased by 164 kb/d to 640 kb/d (Red Markers). In addition the same source provided production for September and October. It is not clear if the red markers represent all liquids production or C + C. Both numbers will be tracked and compared to see if there is a consistent difference between the two estimates.
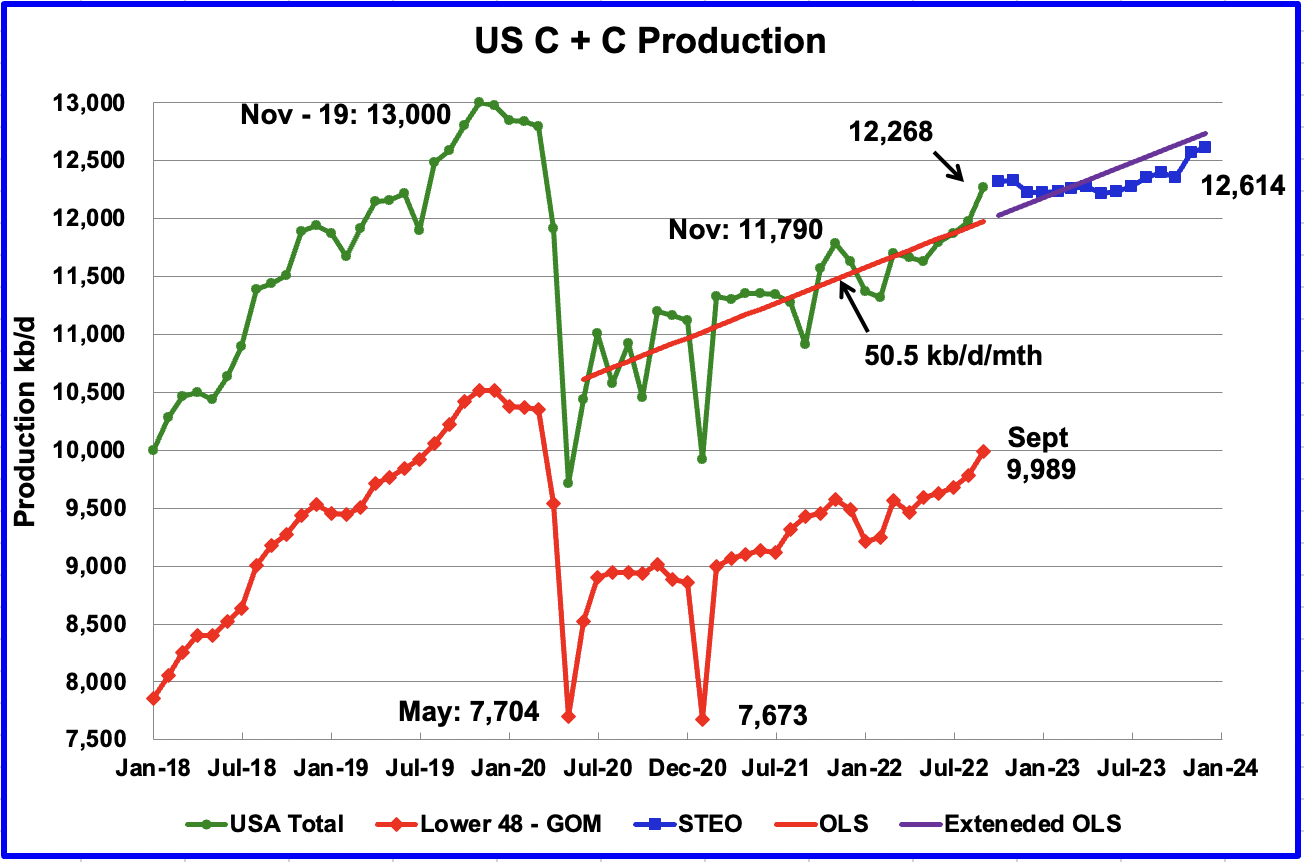
U.S. September production increased by 289 kb/d to 12,268 kb/d, a post-pandemic record. For September, the states with the largest increase were Texas 90 kb/d, New Mexico 75 kb/d and North Dakota 43 kb/d. The Gulf of Mexico added 64 kb/d.
The blue graph, taken from the December 2022 STEO, is the production forecast for the U.S. from October 2022 to December 2023. Output for December 2023 is expected to be 12,614 kb/d, 34 kb/d higher than projected in the STEO’s November report. Note that from October 2022 to October 2023, output is forecast to be essentially flat, 12,326 kb/d vs 12,356 kb/d, respectively, a minimal 30 kb/d increase.
The red OLS line from June 2020 to September 2022 indicates a monthly production increase of 50.5 kb/d/mth over that period. The first portion of red line stops at September because that is the range covered by the OLS analysis. The second portion is the same OLS line extended to see how well it fits the STEO forecast.
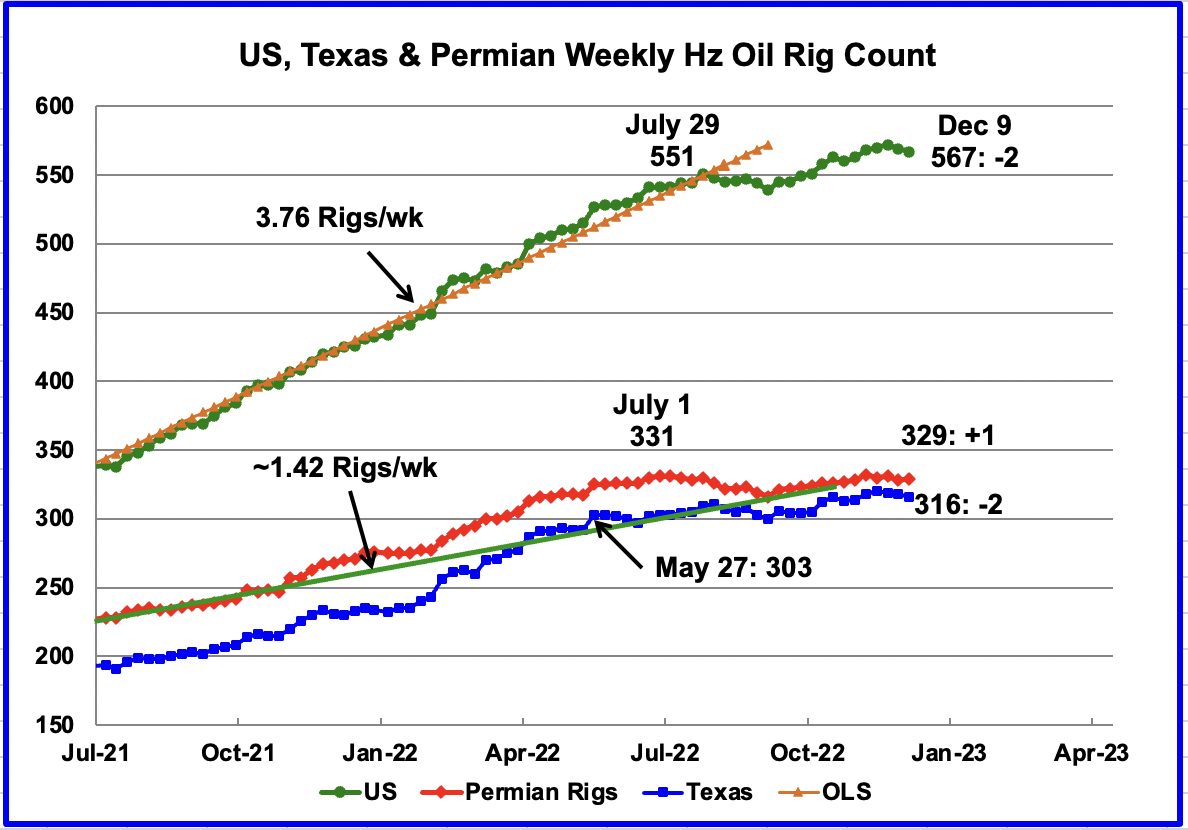
After the week ending July 29, the rate of Hz rig additions slowed. However since the low of 539 in the week of September 9, Hz rig growth returned until the Thanksgiving Xmas break period. From a high of 572 rigs in the week ending November 25, the rig count has dropped by 5 to 567 in the week ending December 9.
Permian rigs were up 1 to 329 in the week ending December 9 but still 2 below the July 1 peak of 331. With Permian rigs essentially flat since July 1, this implies that rig activity has increased in the other basins. Texas rigs dropped by 2 to 316.
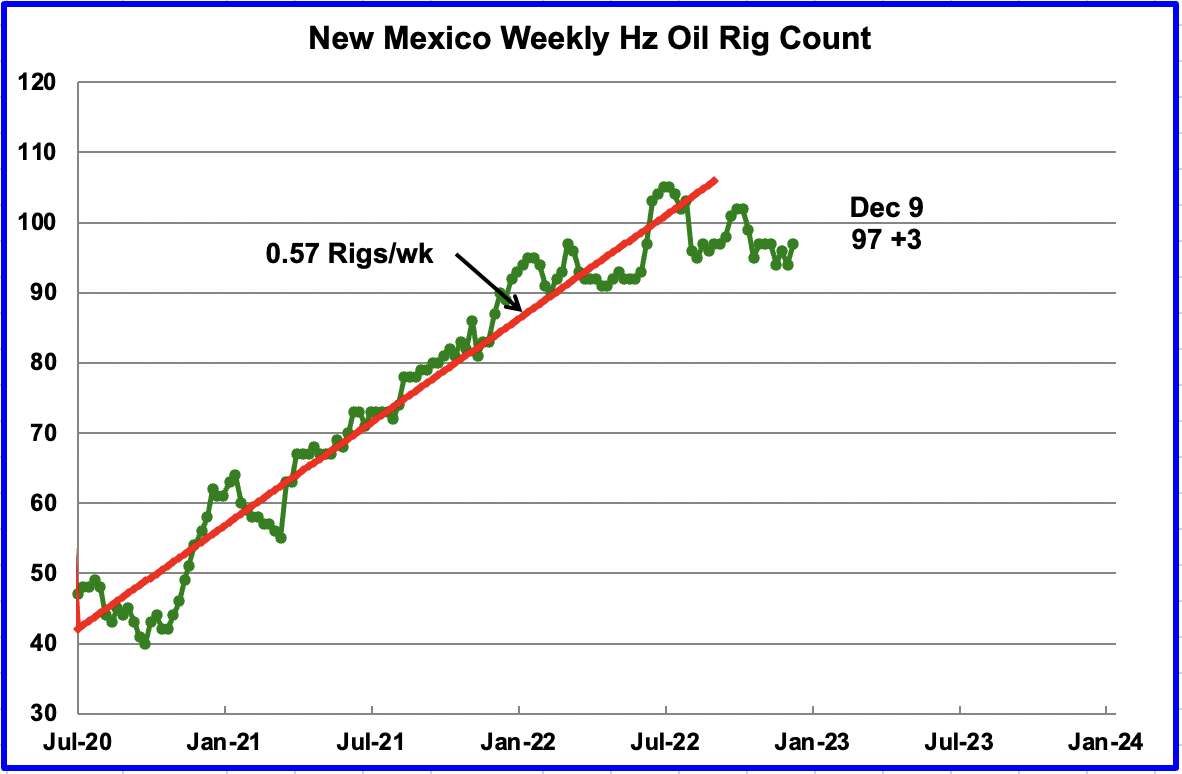
New Mexico added 3 rigs to get back to 97 operational rigs. Since mid-August, New Mexico’s operating rigs have remained close to 97.
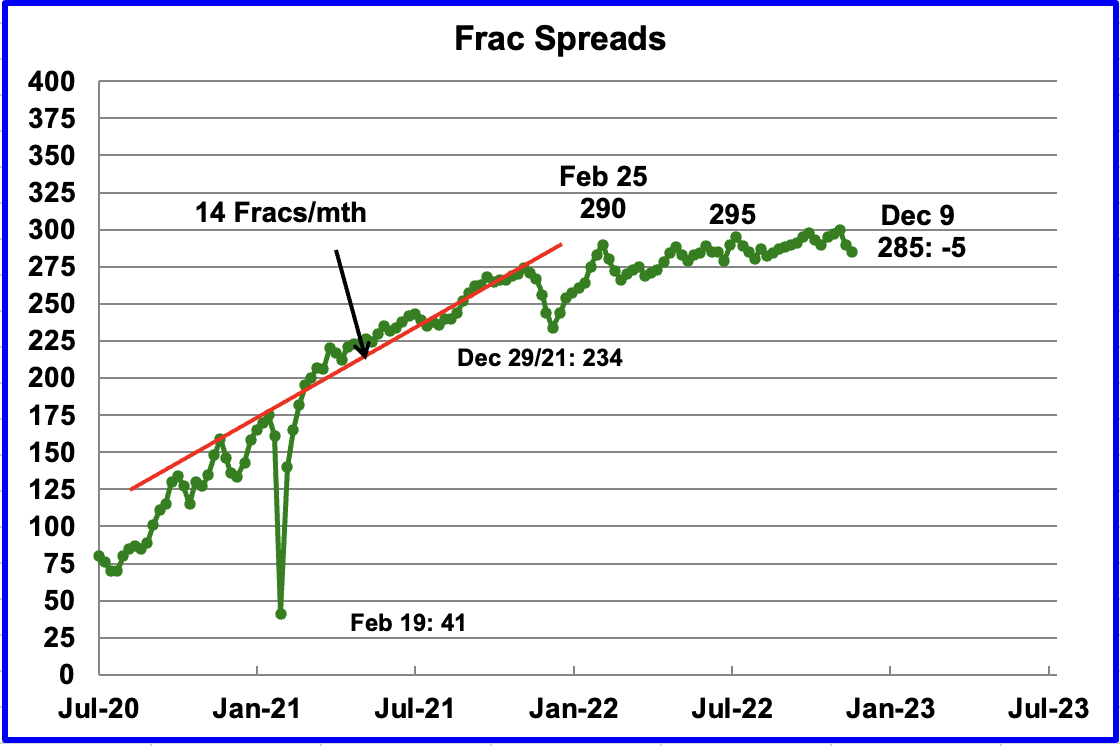
For frac spreads, the general trend since late February, when the count was 290, can best be described as essentially flat at around the 290 level. For the week ending December 9, the frac spread count decreased by 5 to 285.
Last year the frac count peaked in mid November and then headed into the Thanksgiving and Christmas break low of 234 in December 2021. This week continues the decline that started last week.
Note that these 285 frac spreads include both gas and oil spreads.
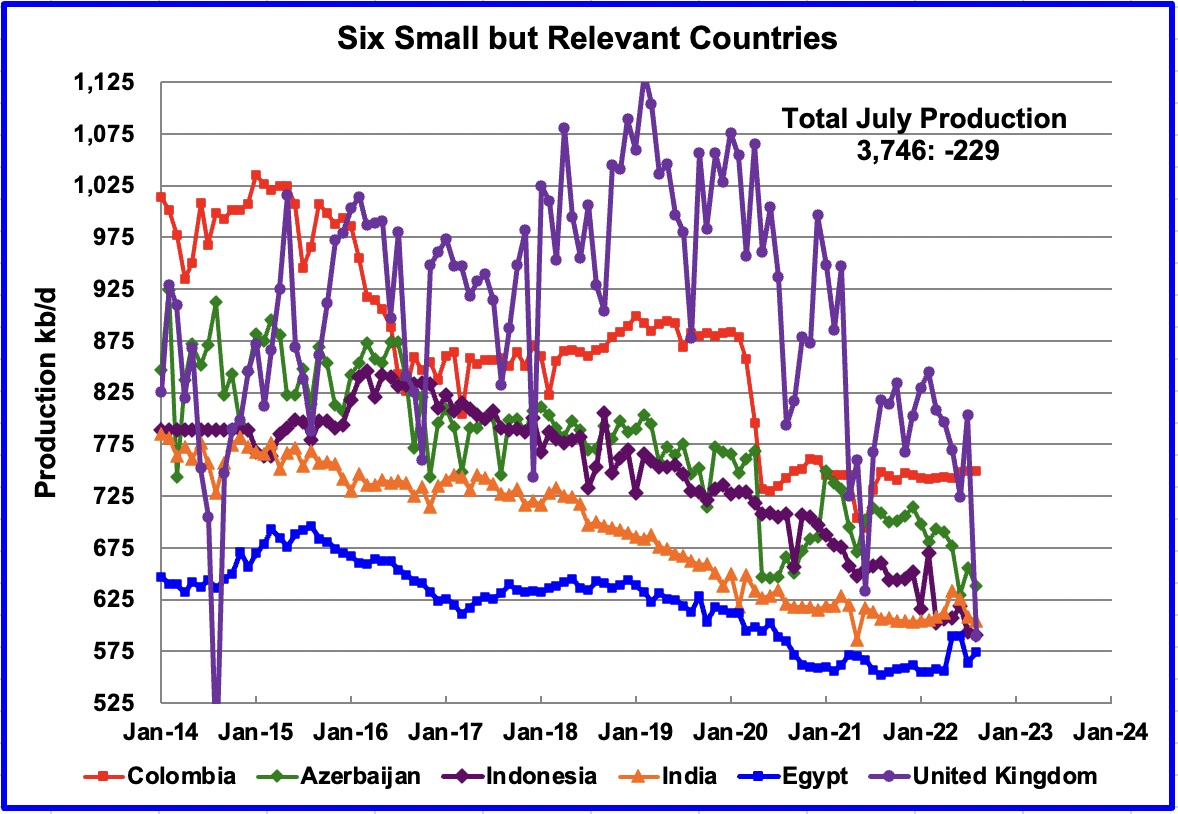
These six countries complete the list of Non-OPEC countries with annual production between 500 kb/d and 1,000 kb/d. Note that the UK has been added to this list since its production has been below 1,000 kb/d since 2020.
Their combined August production was 3,746 kb/d, down 229 kb/d from July’s 3,975 kb/d.
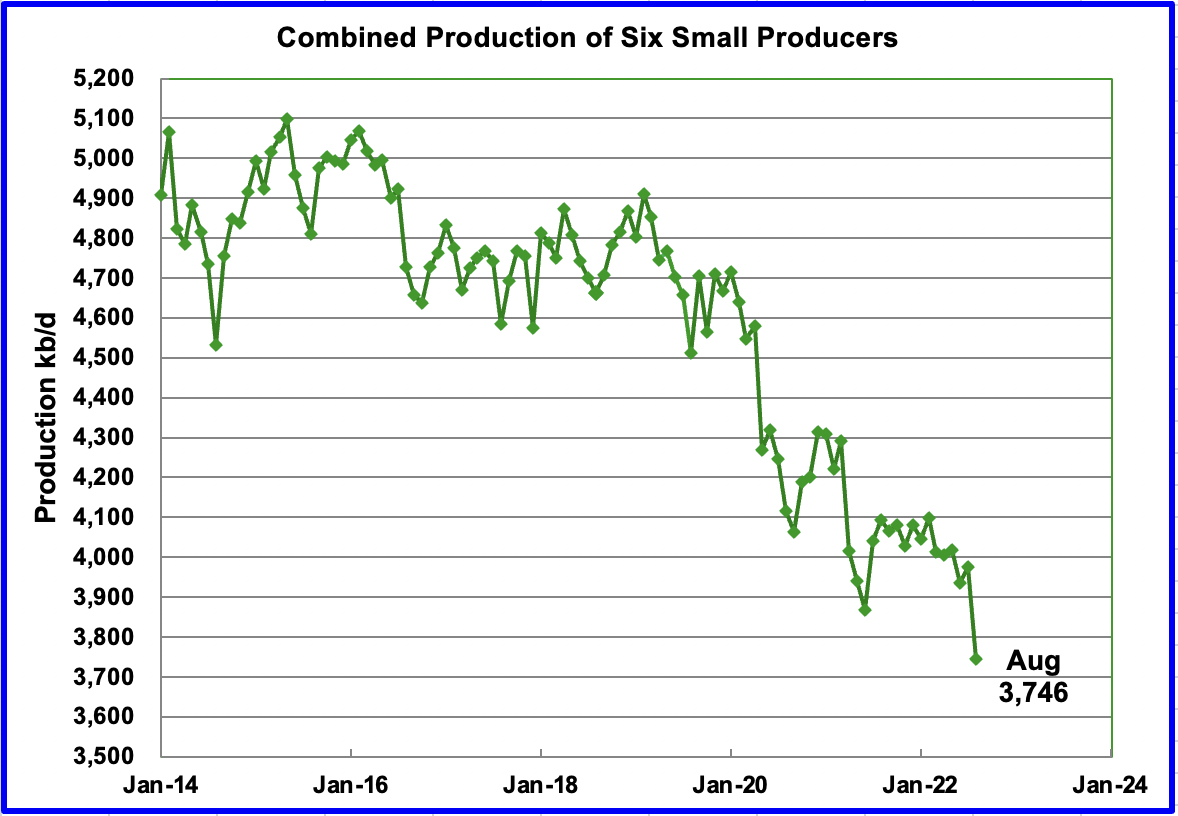
The overall output from the above six countries has been in a slow steady decline since 2014 and the decline continues.
OPEC + Production
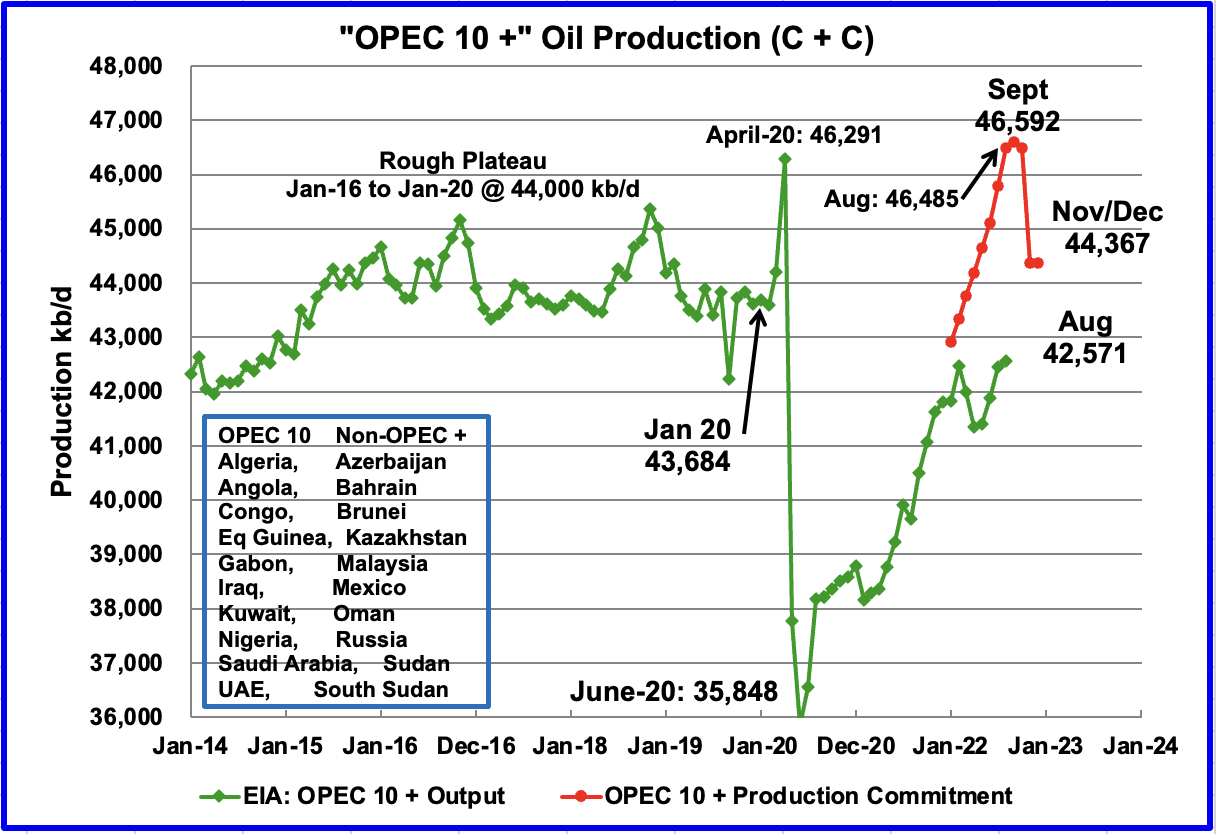
This chart compares the OPEC + commitments with OPEC + production. The OPEC + commitments are based on “Crude” production only. To adjust the OPEC + commitments to C + C, they were increased by 6%. The July and August total OPEC outputs from the MOMR were compared with the EIA C + C information. They averaged out to 6%.
Looking at August specifically, the gap between the OPEC + commitment and delivered for C + C is 3,914 kb/d.
World Oil Production Ranked by Country
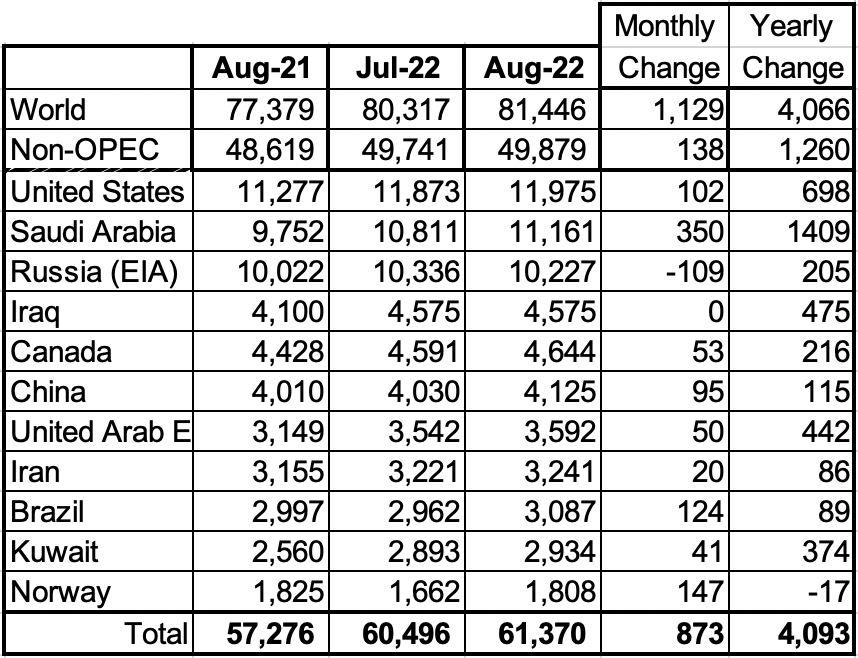
Above are listed the World’s 11th largest oil producers.
In August 2022, these 11 countries produced 75.4% of the world’s oil. On a YoY basis, production from these 11 countries increased by 4,066 kb/d. Note that every country except Russia increased production in August.
The largest increase came from Saudi Arabia 350 kb/d.
World Oil Production Projection
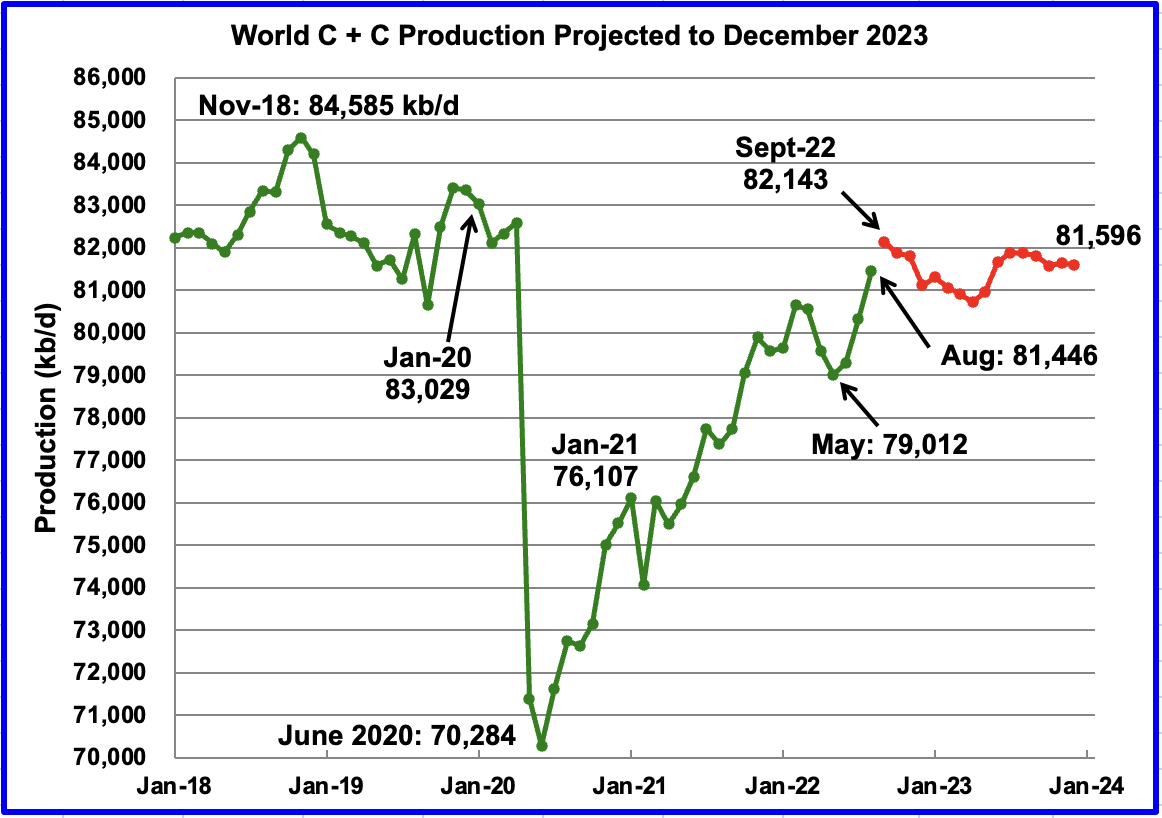
World oil production in August increased by 1,129 kb/d to 81,446 kb/d according to the EIA (Green graph). In the previous Non-OPEC post, it was forecast that August C + C production was expected to increase by 1,357 kb/d to 81,548 kb/d, high by 228 kb/d and 102 kb/d, respectively.
This chart also projects World C + C production out to December 2023. It uses the December 2022 STEO report along with the International Energy Statistics to make the projection. (Red markers).
It projects that World crude production in December 2023 will be 81,596 kb/d, an increase of 563 kb/d from the projection in the previous November report.
September production is expected to increase by 697 kb/d to 82,143 kb/d. The post pandemic peak of 82,143 kb/d will be reached in September 2022. After September 2022, World production decreases and September 2022 could be the new post-pandemic high out to December 2023. The projected September peak could change due the large expected November increase from Kazakhstan shown above and continuing monthly increases from Brazil.
Note that the post pandemic peak of 82,143 kb/d is 2,442 kb/d lower than November 2018.
Leave a Reply